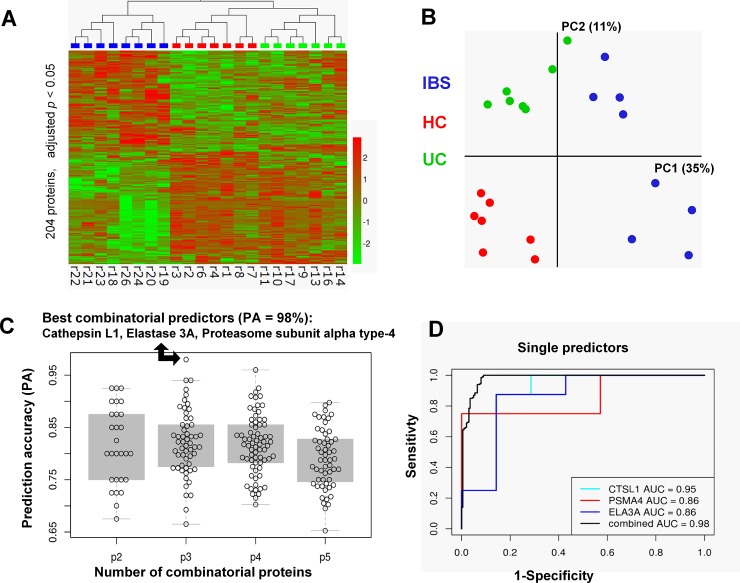
Fig 2. Proteome analysis of mucosal biopsy supernatants.
Proteome analysis revealed significantly different protein levels and pattern in biopsy supernatants from IBS, HC or UC. (A) 204 proteins exhibit different levels between the three groups (p < 0.05, Benjamini-Hochberg adjusted). Hierarchical clustering of z-transformed protein levels reveals striking differences between biopsy supernatants. (B) Principal component analysis of all 22 samples using the 204 proteins corroborates this finding. (C) The subset of the 8 proteins which were significantly upregulated in the IBS patients vs. healthy controls were used to construct predictive models using linear discriminant analysis (left panel). All combinations consisting of 2 to 5 proteins (p1-p5) were examined. The prediction accuracy of each is shown as a dot in the figure. The combination of the three proteases cathepsin L1 (CTSL1), proteasome subunit alpha type 4 (PSMA4), and elastase 3A (ELA3A) resulted in the highest value of prediction accuracy of 98%, marked with an arrow. Single ROC curves plotted for the three protein predictors CTSL1, PSMA4, and ELA3A are shown in the right panel. The area under the curve (AUC), as a measure of the discriminatory value of individual or combinatorial proteins, showed the highest value for the protein combination. Note, for none of the individual proteins the specificity to discriminate between the HC and the IBS groups was lower than 85% at a given sensitivity of 75%.

