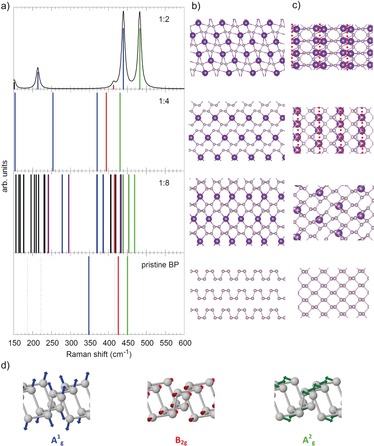
Figure 2.

Pristine BP and the most stable (crystalline) K intercalation compounds (K:P=1:8, 1:4, and 1:2). a) Theoretically predicted Raman shifts for pristine BP and K intercalation compounds. For details, see text. b) Structure of pristine BP viewed in armchair direction and corresponding views of the most stable K intercalation compounds. c) Top view of one “sheet” of BP and the K intercalation compounds. In case of K:P=1:4 and 1:2 the separate P ribbons are indicated by red dots. d) Visualization of the Raman active vibrations of BP, color coding as in (a). For details see text.
