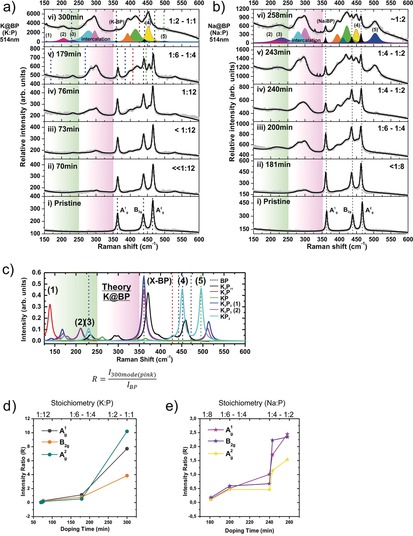
Figure 3.

Vapor‐phase intercalation of BP monitored by Raman spectroscopy. In situ Raman spectra of K (a) and Na (b) intercalated black phosphorous (BP) measured at different doping times. The fitting of all the observed components using Voigt functions have been marked in different colors. Assigned peaks are marked when corresponding. c) Calculated Raman spectra of semiconducting K‐P phases considered herein. A Lorentzian broadening was applied (HWHM=5.0 cm−1). For comparison, the theoretically predicted Raman shifts of pristine BP are indicated by dotted lines. The area corresponding to intermetallic phases and KP2 is highlighted in green, and that related with characteristic double peak of the intercalation compounds between 250 and 350 cm−1 is highlighted in pink. Intensity ratio (R) as defined in the inset of (c), from the intercalation compound 300 cm−1 component versus the three main vibrational modes in BP: A1 g, B2g, and A2 g, plotted with respect to the doping time for potassium (d) and sodium (e) BPICs.
