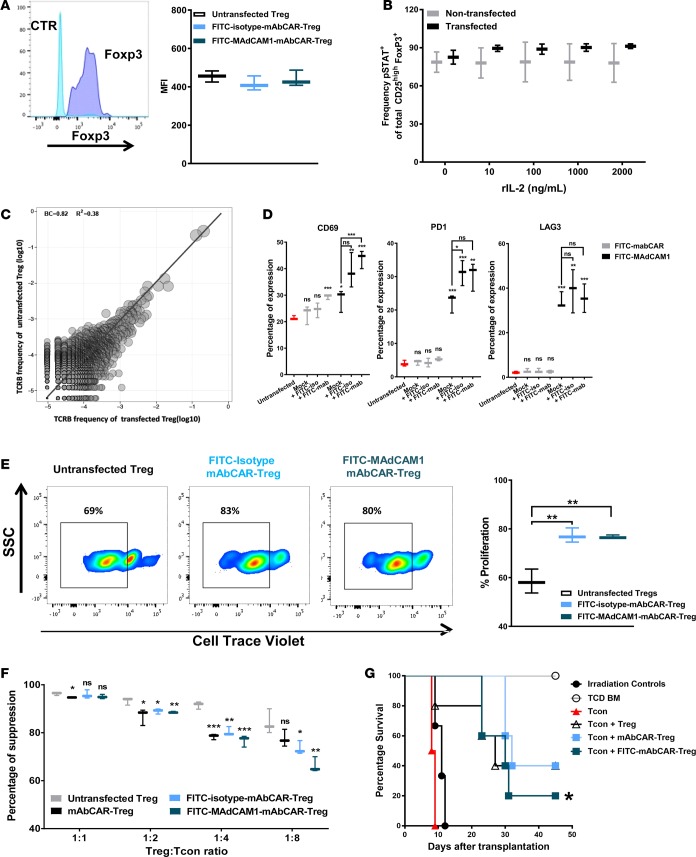
Figure 4. mAbCAR Tregs retain phenotype and function.
(A) mAbCAR Tregs retain FoxP3 expression. Histograms of sample FoxP3 staining (dark blue) in comparison to isotype control (light blue) of FoxP3+ selected Tregs. FoxP3 intranuclear expression in untransfected Tregs, FITC-isotype-mAbCAR Tregs, and FITC-MAdCAM1-mAbCAR Tregs. Mean fluorescence intensity (MFI) of 1 representative of 3 consecutive experiments is reported. (B) mAbCAR Tregs retain STAT5 phosphorylation. Frequency of phosphorylated STAT5 expression in untransfected and transfected Tregs. One representative of two consecutive experiments is reported. (C) mAbCAR Treg TCRβ repertoire is unchanged. The TCRβ CDR3 clone frequency was obtained by TCR nucleotide sequencing. Pearson correlation between untransfected and transfected Tregs is r = 0.92, P < 2.2–16. One representative of two consecutive experiments is reported. (D) Exposure to FITC-coupled antibodies activates mAbCAR Tregs. Whiskers plots represent percentage of expression of selected markers (CD69, LAG3, PD1) before or after in vitro exposure to FITC (24 hours) in mAbCAR Tregs. Data show marker expression in untransfected Tregs (red), mock transfected Tregs (black), and mAbCAR Tregs (gray). n = 2 independent experiments. (E) FITC mAbCAR expression and antibody binding increase Treg proliferation. Percentage of proliferation of untransfected Tregs, FITC-isotype-mAbCAR Tregs, and FITC-MAdCAM1-mAbCAR Tregs after culture with anti-CD3/CD28 beads, measured through cell trace violet dilution. Sample FACS analysis is also shown. One representative of two consecutive experiments is reported. (F) mAbCAR Tregs suppress activated T cells in vitro. Percentage of suppression of T cell proliferation by untransfected Tregs, mAbCAR Tregs, FITC-isotype-mAbCAR Tregs, and FITC-MAdCAM1-mAbCAR Tregs after 4 days stimulation with irradiated allogeneic splenocytes at T cell/Treg ratios of 1:1, 1:2, 1:4, and 1:8, measured through cell trace violet analysis. One representative of two consecutive experiments is reported. (G) mAbCAR Tregs prevent GVHD in vivo. Survival of lethally irradiated BALB/c mice that received allogeneic irradiation alone, TCD BM alone, TCD BM + Tcons, TCD BM + Tcons + untransfected Tregs, TCD BM + Tcons + mAbCAR Tregs, and TCD BM + Tcons + FITC-isotype-mAbCAR Tregs. One representative of three consecutive experiments is reported; at least 3 mice/group were used. Log-rank survival test; for differences between TCD BM + Tcons versus TCD BM + Tcons + untransfected Tregs or TCD BM + Tcons + mAbCAR Tregs or TCD BM + Tcons + FITC-isotype-mAbCAR Tregs. (A, B, and D–F) Two-tailed Student’s t test; mean ± SEM; *P < 0.05; **P < 0.01; ***P < 0.001.

