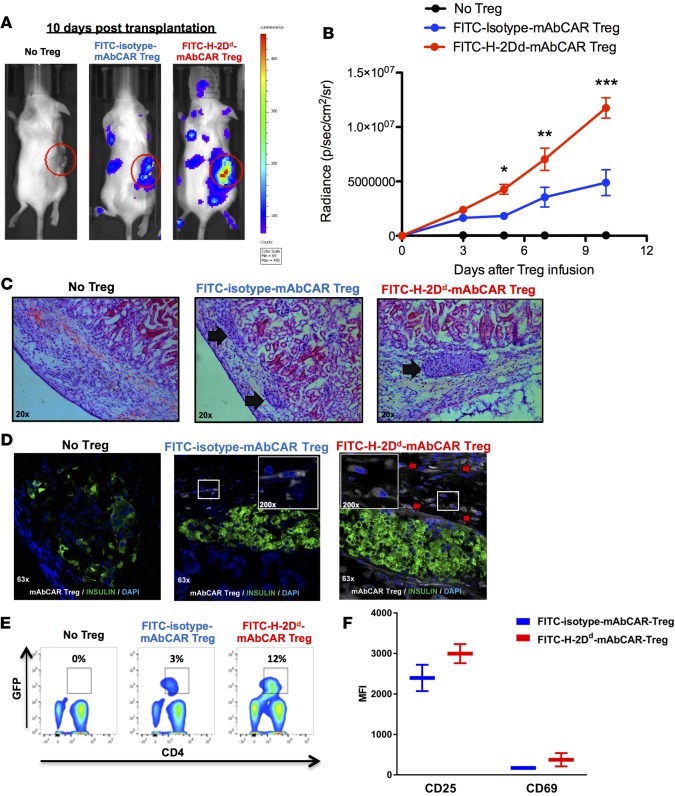
Figure 6. FITC-H-2Dd-mAbCAR Tregs home and expand in proximity to allogeneic pancreatic islet grafts.
(A) FITC-H-2Dd-mAbCAR Tregs show enhanced localization to the islet allograft. Representative BLI images of sublethally irradiated mice that received a graft of allogeneic pancreatic islets alone, pancreatic islets + luc+ FITC-isotype-mAbCAR Tregs, and pancreatic islets + luc+ FITC-H-2Dd-mAbCAR Tregs at day 10 after adoptive transfer. Data are representative of 1 of 3 consecutive experiments. (B) BLI-based quantification of FITC-H-2Dd-mAbCAR Tregs in proximity of the graft. The graph represents BLI signal from standardized regions of interest in left kidney area (graft site) in sublethally irradiated mice that received a graft of allogeneic pancreatic islets alone (black), pancreatic islets + luc+ FITC-isotype-mAbCAR Tregs (blue), and pancreatic islets + luc+ FITC-H-2Dd-mAbCAR Tregs (red) at day 3, 5, 7 and 10 after adoptive transfer. Data are representative of 1 of 3 consecutive experiments; at least 5 mice per group were used. ANOVA test with Bonferroni post-test; mean ± SEM; *P < 0.05; **P < 0.01; ***P < 0.001. (C) Mice receiving FITC-H-2Dd-mAbCAR Tregs show improved islet allografts. Representative hematoxylin and eosin–stained histologic sections of allogeneic pancreatic grafts in mice that received no Treg treatment, GFP+-FITC-isotype-mAbCAR Tregs, or GFP+-FITC-H-2Dd-mAbCAR Tregs 10 days after transplantation and Treg transfer (arrows = pancreatic islets under the kidney capsule). Original magnification, ×20. (D) FITC-H-2Dd-mAbCAR Treg localization in proximity of the grafts. Confocal microscopy analysis demonstrates presence of transferred Tregs (GFP+, white, red arrows) in proximity of islet grafts (insulin, green) only in mice that received GFP+-FITC-H-2Dd-mAbCAR Tregs. Data are representative of 1 of 3 consecutive experiments; at least 5 mice/group were used. Original magnification, ×63; ×200 (insets). (E) Mice receiving FITC-H-2Dd-mAbCAR Tregs show increased Treg numbers. Percentage of transferred GFP+ Tregs in spleens of mice that received no Treg treatment, FITC-isotype-mAbCAR Tregs, and FITC-H-2Dd-mAbCAR Tregs at 10 days after transplant. Data are representative of 1 of 2 consecutive experiments; at least 4 mice per group were used. (F) Mice receiving FITC-H-2Dd-mAbCAR Tregs show increased Treg activation. Expression of CD25 and CD69 was assessed by flow cytometry in previously transferred GFP+ Tregs reisolated from spleens of mice that received FITC-isotype-mAbCAR Tregs (blue) or FITC-H-2Dd-mAbCAR Tregs (red) at 10 days after transplant. Data are representative of 1 of 2 consecutive experiments; at least 4 mice/group were used.

