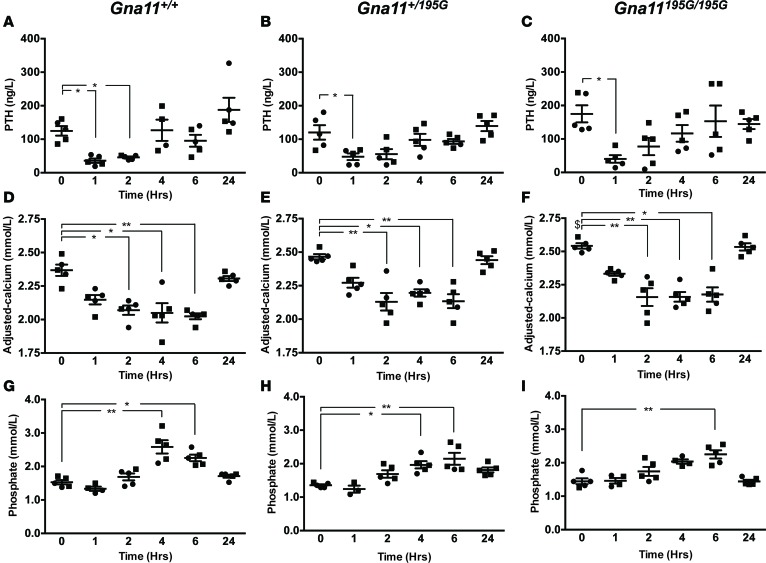
Figure 5. In vivo effect of cinacalcet on plasma PTH, calcium, and phosphate concentrations of Gna11+/+, Gna11+/195G, and Gna11195G/195G mice.
(A–C) Plasma parathyroid hormone (PTH), (D–F) plasma albumin–adjusted calcium, and (G–I) plasma phosphate concentrations are shown at 0, 1, 2, 4, 6, and 24 hours following oral gavage administration of a single 30 mg/kg cinacalcet dose. Mean values for the respective groups are indicated by solid bars. n = 4–5 mice per study time point. Squares, males; circles, females. A Kruskal-Wallis test followed by Dunn’s test for nonparametric pairwise multiple comparisons were used for analysis of A–I. *P < 0.05, **P < 0.01 compared with respective untreated mice. $Untreated Gna11195G/195G mice were significantly (P < 0.05) hypercalcemic compared with untreated Gna11+/+ mice.

