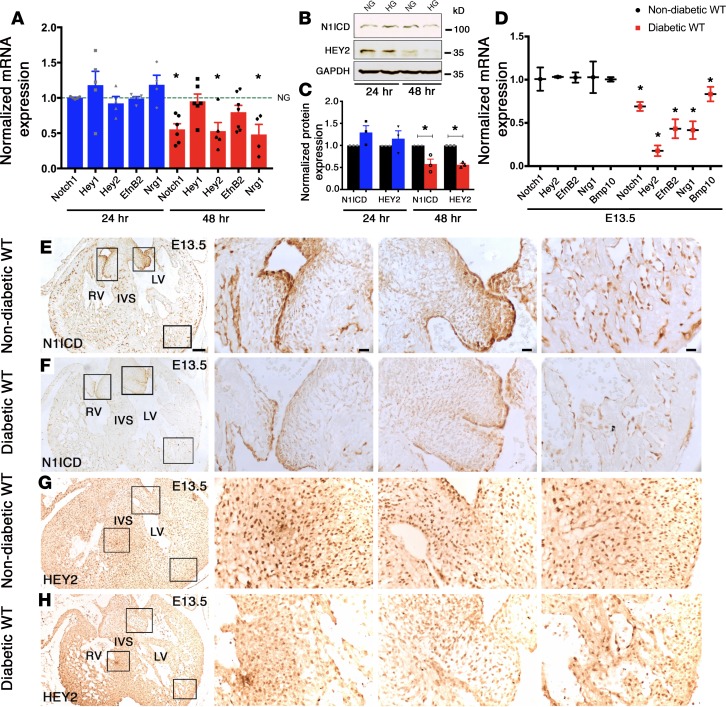
Figure 1. Hyperglycemia downregulates Notch1 pathway.
(A) Transcript levels of Notch1, Hey1, Hey2, EfnB2, and Nrg1 in AVM cells cultured in HG (25 mM) for 24 hours (blue) and 48 hours (red) by RT-qPCR (n ≥ 3). Comparisons to NG (5.5 mM), represented by the dotted line set to 1; data represent mean ± SEM. (B) N1ICD and HEY2 protein expression in AVM cells cultured in NG and HG for 24 hours and 48 hours. (C) Quantification of protein expression normalized to GAPDH (n = 3; mean ± SEM). (D) Examination of E13.5 WT murine hearts of nondiabetic and diabetic dams shows downregulation of Notch1, Hey2, EfnB2, Nrg1, and Bmp10 mRNA by RT-qPCR (n = 6 pooled hearts/group; mean ± SD). (E–H) Decreased expression of N1ICD and HEY2 in embryonic hearts exposed to maternal diabetes by immunohistochemistry (n = 3). Square boxes in left column in E–H are shown in higher magnifications from left to right. LV, left ventricle; RV, right ventricle; IVS, interventricular septum. *P < 0.05, 2-tailed Student’s t test in C, with Holm-Bonferroni correction in A and D. Scale bars: 100 μm (E–H, left column); 20 μm (E–H, center and right columns).

