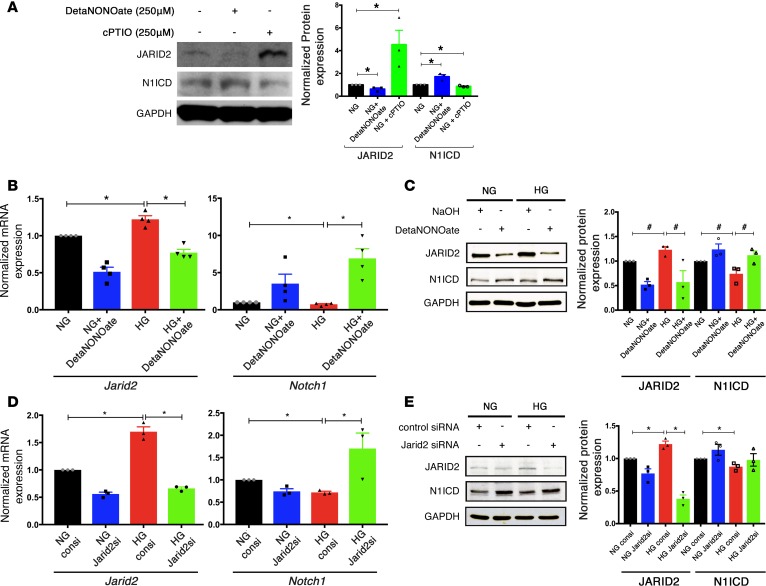
Figure 5. NO mediated Jarid2 repression restores Notch1 expression.
(A) Immunoblot showing JARID2 and N1ICD levels in normoglycemic AVM cells treated with 250 μM DetaNONOate and 250 μM cPTIO as NO donor and quencher for 48 hours. The graph shows quantification (n = 3; mean ± SEM; *P < 0.05, 2-tailed Student’s t test). (B) Jarid2 and Notch1 mRNA expression and (C) JARID2 and N1ICD protein levels in AVM cells cultured in NG (5.5 mM) and HG (25 mM) with 250 μM DetaNONOate. 0.01 M NaOH served as vehicle control. Immunoblot quantification in C (n ≥ 3; mean ± SEM; #P < 0.05 by 2-tailed Student’s t test, not significant with Holm-Bonferroni correction). (D and E) RT-qPCR and representative immunoblot showing expression of Jarid2 and N1ICD in AVM cells after treatment with Jarid2 siRNA or control siRNA cultured in NG or HG. Immunoblot quantification in E (n ≥ 3; mean ± SEM; *P < 0.05, 2-tailed Student’s t test with Holm-Bonferroni correction in B, D, and E).

