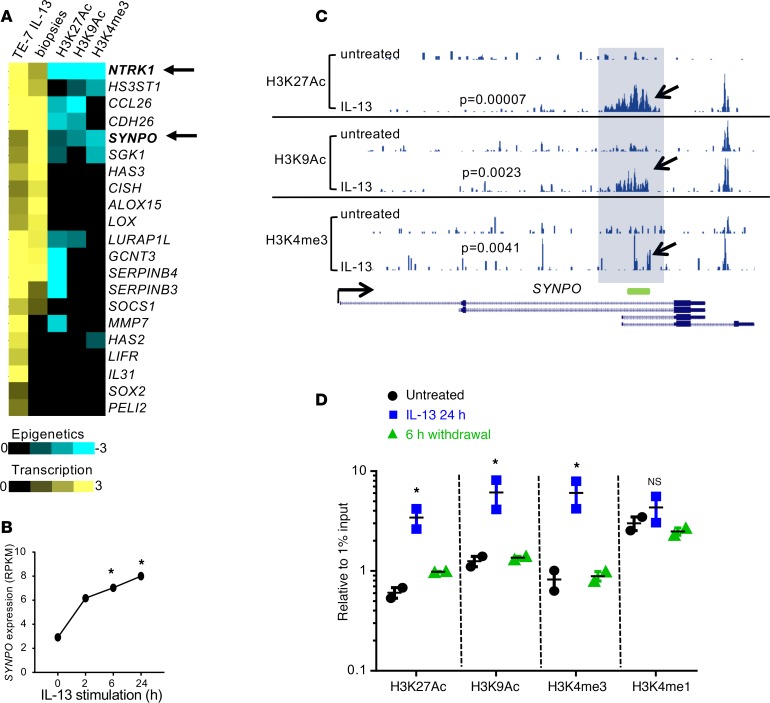
Figure 1. Transcriptional and epigenetic regulation of SYNPO in TE-7 cells.
(A) The heatmap shows transcriptional and epigenetic changes in TE-7 cells in response to IL-13 stimulation for 6 hours or eosinophilic esophagitis (EoE) biopsies compared with controls. The yellow color represents log2 fold change in gene expression compared with controls, and the blue color represents M values for the indicated histone mark (note that negative M value indicates increased level of epigenetic marks; see Methods for details). (B) The expression of SYNPO in TE-7 cells stimulated with IL-13 at 100 ng/ml is shown (data are from ref. 15). *P < 0.05, DESeq analysis. RPKM, reads per kilobase per million reads. (C) An image capture from the USCS browser shows the epigenetic landscape for H3K27Ac, H3K9Ac, and H3K4me3 marks in TE-7 cells in the SYNPO gene. The promoter area of SYNPO isoforms 1 and 2 (see Figure 2A for details) is shaded. Arrows point to the histone mark peaks that are significantly increased after 6 hours of IL-13 stimulation. P values comparing IL-13–stimulated cells with untreated cells were calculated by using a MAnorm algorithm. The green rectangle shows the position of the probe used for ChIP-PCR experiments. The read depths of the aligned sequences are of the same scale. (D) The level of the indicated epigenetic marks was assessed in the promoter of SYNPO isoforms 1 and 2 by ChIP-PCR after a 24-hour IL-13 stimulation and subsequent IL-13 withdrawal for 6 hours. One of two independent experiments is shown; the dots represent the mean ± SD for technical replicates. *P < 0.05, compared with untreated cells by ANOVA.

