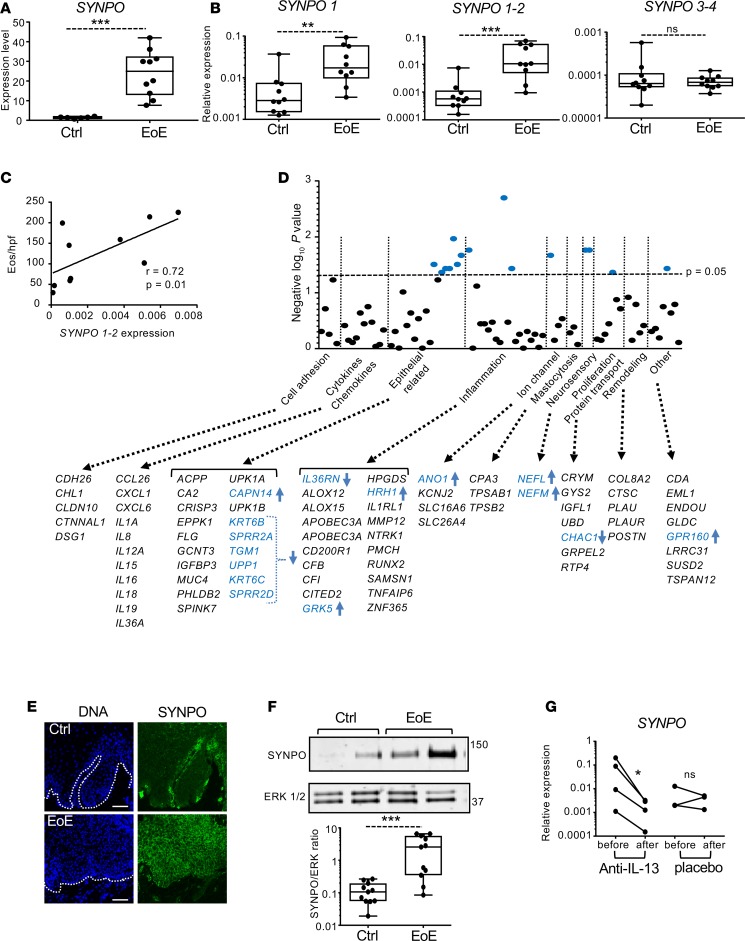
Figure 4. Expression of SYNPO in esophageal biopsies and correlation with EoE transcriptome.
(A) The normalized expression level for SYNPO in esophageal biopsy tissue from patients with active EoE (n = 10) and control patients (n = 6) (8). ***P < 0.001, t test. (B) The relative expression level of SYNPO isoforms (see Figure 2A) in esophageal biopsies from patients with active EoE and without EoE (Ctrl) was quantified by measuring expression of SYNPO PCR products. For A–C, each dot represents an esophageal biopsy from independent patients. (A and B) **P < 0.01, ***P < 0.001, Holm-Sidak method. (C) The correlation between the expression of SYNPO (PCR product 1–2) and the number of eosinophils per high-power field (Eos/hpf) in an EoE esophageal biopsies. The Spearman correlation (r) and P value are indicated. (D) The graph shows correlation of SYNPO expression with EoE molecular signature genes from RNA-sequencing analysis of EoE patients (8). Gene categories were based on those used for the molecular diagnostics panel for EoE (27). The significance of the correlation is plotted as a negative log(10) P value. The horizontal dashed line represents P = 0.05. The genes probed in each category are indicated; significantly correlated genes are in blue font. Arrows indicate positive (up) and negative (down) correlation. (E) Representative immunofluorescence of SYNPO in esophageal biopsies from independent patients. The white dotted line demarcates the basement membrane. Scale bar: 100 μM. (F) A representative Western blot for SYNPO in control and EoE biopsies; ERK 1/2 is used as a loading control. Quantification of SYNPO expression was performed in control and EoE biopsies from independent patients (n = 11 per each group). ***P < 0.001, Holm-Sidak method. (G) Relative expression level of SYNPO was assessed in the EoE patients either treated with anti–IL-13 antibody or placebo, as described in ref. 29. “Before” corresponds to the beginning of the study, and “after” corresponds to day 85 of the study. *P < 0.05, t test. For A, B, and G expression level was normalized to GAPDH. For box-and-whisker plots, the box represents 50th percentile of the data, whiskers show minimum and maximum values, and the line in the box represents the median.

