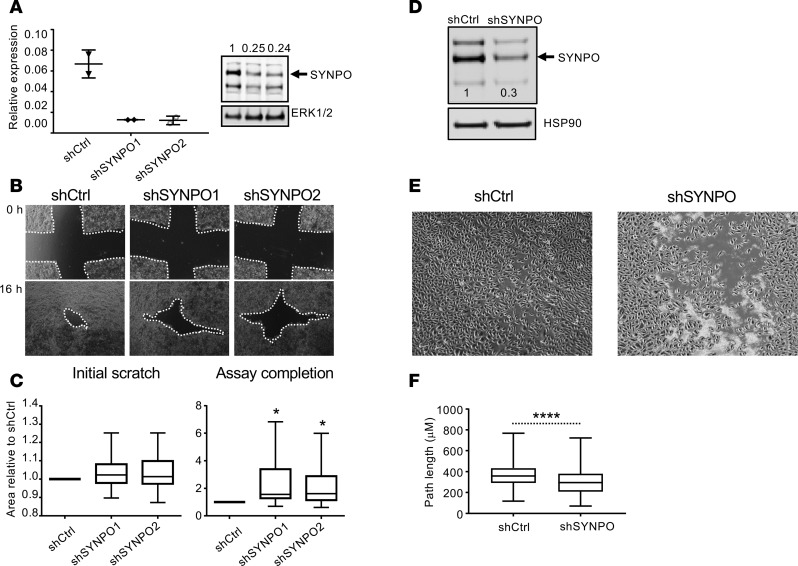
Figure 5. Effect of SYNPO downregulation on esophageal epithelial cell mobility.
(A) Representative RT-PCR and Western blot of SYNPO after stable SYNPO downregulation by two shRNAs in TE-7 cells. The arrow points to SYNPO-long isoform. Expression of SYNPO normalized to ERK 1/2 and then to control shRNA is indicated; the dots represent the mean ± SD for technical duplicates. (B) A wound healing assay was performed in TE-7 cells. Representative images show the scratch area at the beginning of the experiment (0 hours, initial scratch) and at the endpoint (16 hours after initial scratch, assay completion). The white dotted line indicates the scratch area that was quantified in C. (C) Quantification is shown for 5 independent experiments performed in quadruplicates and normalized to the scratch area in control shRNA (shCtrl) samples at the endpoint (shCtrl assay completion); *P < 0.05, ANOVA. (D) A Western blot for SYNPO after stable SYNPO downregulation in EPC2 cells by shRNA (shSYNPO) is shown; the arrow points to SYNPO-long isoform. The relative level of SYNPO expression normalized to HSP90 and then to shCtrl SYNPO expression is indicated by the numbers on the image. (E) A representative image of the wound healing assay simultaneously performed for control cells and cells with downregulated SYNPO expression (shCtrl and shSYNPO, respectively) is shown for the assay completion (8 hours) time point. Note that the control cells are fully confluent, whereas the shSYNPO cells still have visible gaps. (F) The overall distance traveled by 300 cells in the wound over the course of the wound healing assay for three independent experiments combined are shown; ****P < 0.0001, t test. For box-and-whisker plots, graphs the box represents 50th percentile of the data, whiskers show minimum and maximum values, and the line in the box represents the median. Original magnification, ×10 (B and E).

