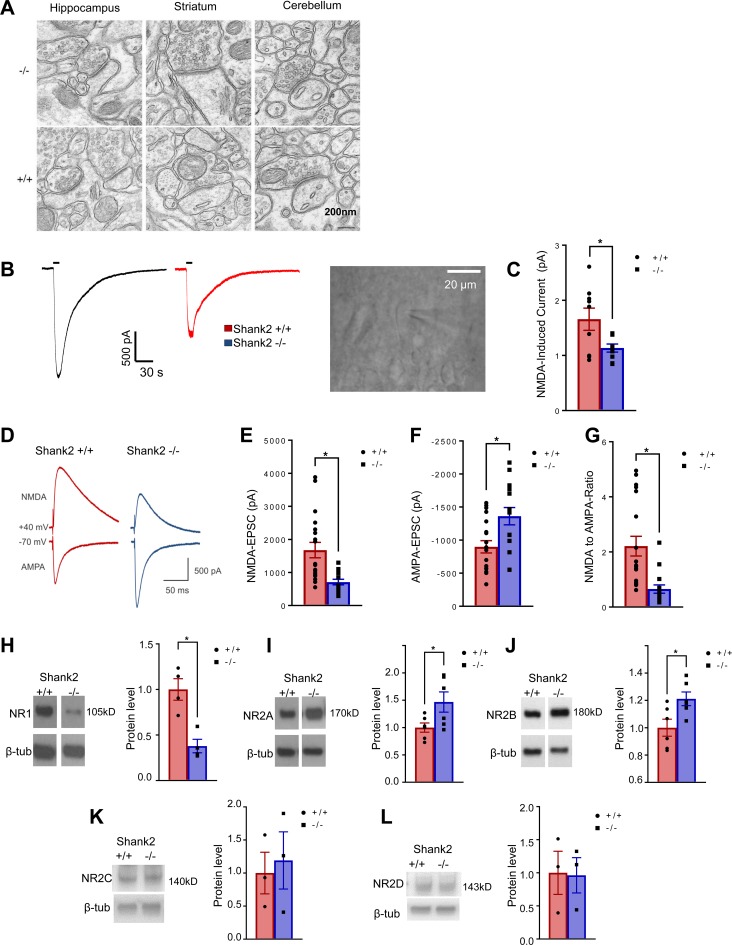
Figure 6. Altered PSD ultrastructure, NMDAR- and AMPAR-mediated currents, and the expression of NMDAR subunits in Δe24–/– hippocampus.
(A) PSD structure in synapses of hippocampus CA1, striatum, and cerebellum of e24+/+ and Δe24–/– mice by electron microscopy. Note the slight but statistically significant reduction of dark part of PSD in hippocampal CA1 synapses but not striatal and cerebellar synapses in Δe24–/– mice (see Table 1). Scale bar: 200 mm. (B and C) The NMDA currents in hippocampal CA1 neurons of Δe24–/– mice were reduced in response to the bath application of NMDA than those from e24+/+ mice. Traces and image of a cell being patched for recording in B (original magnification, ×40) and quantification of NMDA-induced currents for e24+/+ and Δe24–/– mice in B (unpaired 2-tailed t test, *P < 0.05, +/+ vs. –/– mice; n = 14–16 cells /genotype). (D) Representative traces of evoked NMDAR eEPSCs (at +40 mV) and AMPAR EPSCs (at –70 mV) from whole cells recorded in hippocampal CA1 neurons from Δe24+/+ (black) and Δe24–/– (red) mice. Both of NMDA and AMPA currents were elicited by a 0.25-ms duration and 300-μA stimulation intensity. (E) Reduced NMDAR-mediated eEPSCs in hippocampal CA1 neurons of Δe24–/– mice (+/+ vs. –/–; P = 0.001, unpaired 2-tailed t test). (F) Increased AMPAR-mediated EPSCs in hippocampal CA1 neurons of Δe24–/– mice (+/+ vs. –/–; P = 0.006, unpaired 2-tailed t test). (G) Reduced NMDA/AMPA ratio in neurons of Δe24–/– mice (+/+ vs. –/–; P = 0.0009, unpaired t test) (n = 19 neurons from 4 Δe24+/+ mice and n = 15 neurons from 3 Δe24–/– animals; error bars show SEM; unpaired 2-tailed t test, *P < 0.01). (H) NR1 protein was reduced in PSD fractions of Δe24–/– hippocampi compared with Δe24+/+ hippocampi. (I and J) NR2A and NR2B subunit proteins were increased in PSD fractions of Δe24–/– hippocampi compared with Δe24+/+ hippocampi. (K and L) NR2C and NR2D subunit proteins were not significantly altered in PSD fractions of Δe24–/– hippocampi compared with Δe24+/+ hippocampi (n = 3–6 mice/genotype, unpaired 2-tailed t test, *P < 0.01 +/+ vs. –/–). (See complete unedited blots in the supplemental material.)

