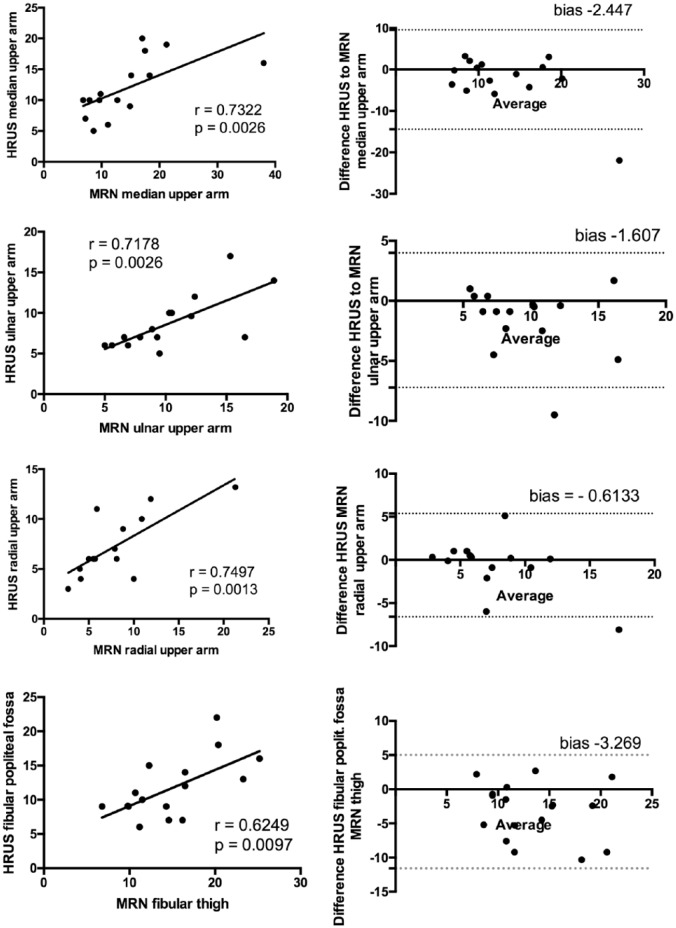
Figure 1.
Correlations between CSA in MRN and HRUS (all values in mm2) and Bland–Altmann plots for the median, ulnar and radial nerve in the upper arm and the fibular nerve.
HRUS-CSA values for all nerves correlated with MRN values for all nerves measured (right side). The Bland–Altman plots (left side) show a negative mean bias (bias = HRUS-CSA − MRN-CSA) between −0.6 and −3.2. These results indicate a fair degree of correlation between the variables with MRN-CSA values being more frequently higher than HRUS-CSA values. Random error is lower for the radial and higher for the fibular nerve. (a) Dashed line, mean bias in Bland–Altman plots; solid line, ±1.96 SD (95% CI).
CSA, cross-sectional area; HRUS, high-resonance nerve ultrasound; magnetic resonance neurography.

