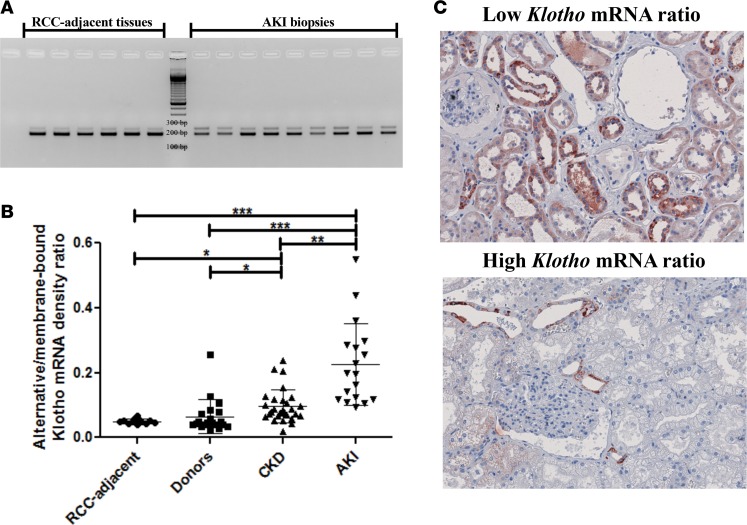
Figure 7. The relative abundance of the Klotho gene transcripts is dysregulated in vivo in renal disease.
(A) RT-PCR analysis of healthy renal cortices and acute kidney injury samples for both Klotho transcripts. (B) Densitometric quantification of renal cell carcinoma–adjacent (RCC-adjacent) healthy renal cortices (n = 12), donor kidney biopsies (n = 20), biopsies from kidneys afflicted with chronic kidney disease (CKD) (n = 28), and biopsies from kidneys suffering from acute kidney injury (AKI) (n = 18). (C) IHC for Klotho on kidneys with high alternative/membrane-bound Klotho mRNA ratios (n = 3) and kidneys with low alternative/membrane-bound Klotho mRNA ratios (n = 3) reveals lower Klotho protein expression in the kidneys with a relatively higher alternative Klotho mRNA abundance. Original magnifications: 200×. *P < 0.05, **P < 0.01, ***P < 0.001, as tested by Kruskal-Wallis test with Dunn’s post-hoc correction. Individual data points are plotted with mean ± SD.

