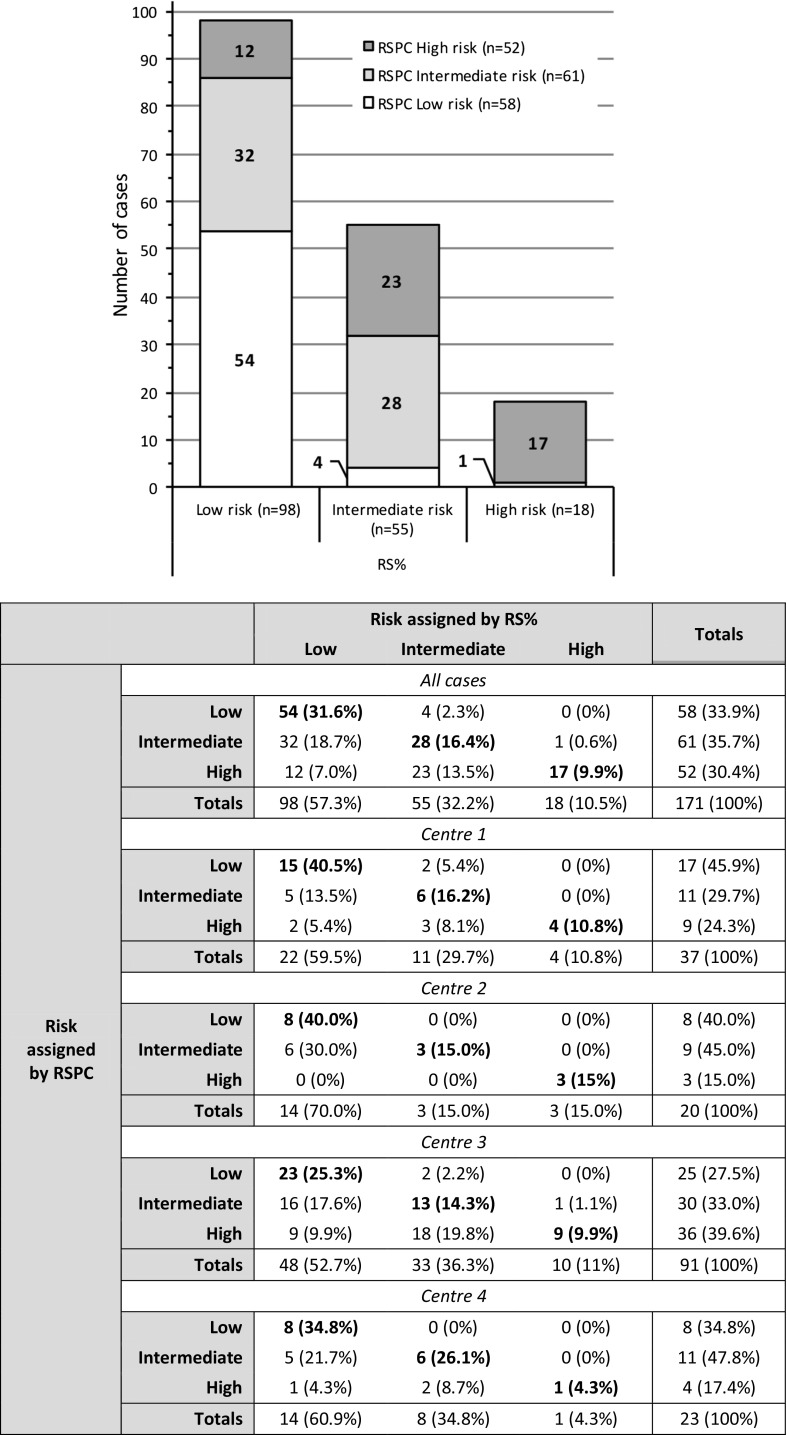
Fig. 1.
(Combined figure) Chart: The histogram shows cross-classification of cases by RS% and RSPC to each risk category. Case numbers were similar for RS% and RSPC with respect to intermediate-risk; however, the number of cases in the low-risk category was very noticeably higher when RS% was used to assign the risk compared to RSPC, and concomitantly, the number designated as high-risk very noticeably lower. Table: Contingency table for risk category assignment. Agreement data are shown for all cases in the study and individually for centre-specific cases

