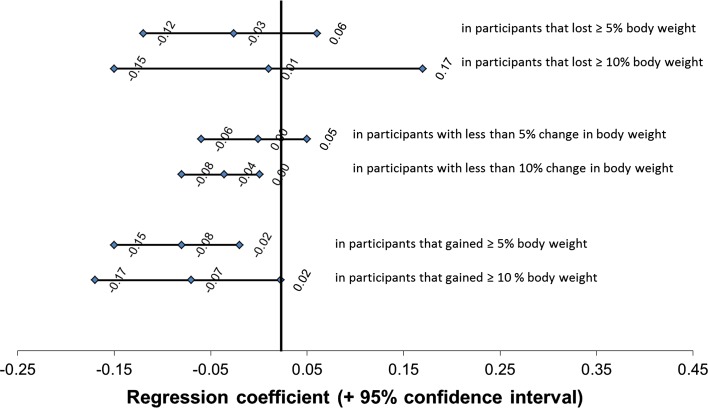
Fig. 1.
Associations between adherence to the “Processed” dietary pattern and BMD of the femoral neck, in strata of body weight change between baseline and visit 4 (n = 2532). 1Regression coefficients and 95 % confidence intervals of the fixed effects. Regression coefficients represent differences in BMD (in sex-specific Z scores) for each Z-score of increase in adherence to the “Processed” dietary pattern using a cut-off of 5 % (solid line) or 10 % (dashed line) change in body weight to define weight loss or weight gain. Models are adjusted for age, sex, initial body weight and height, total energy intake and adherence to the other two dietary patterns. BMD bone mineral density, SD standard deviation

