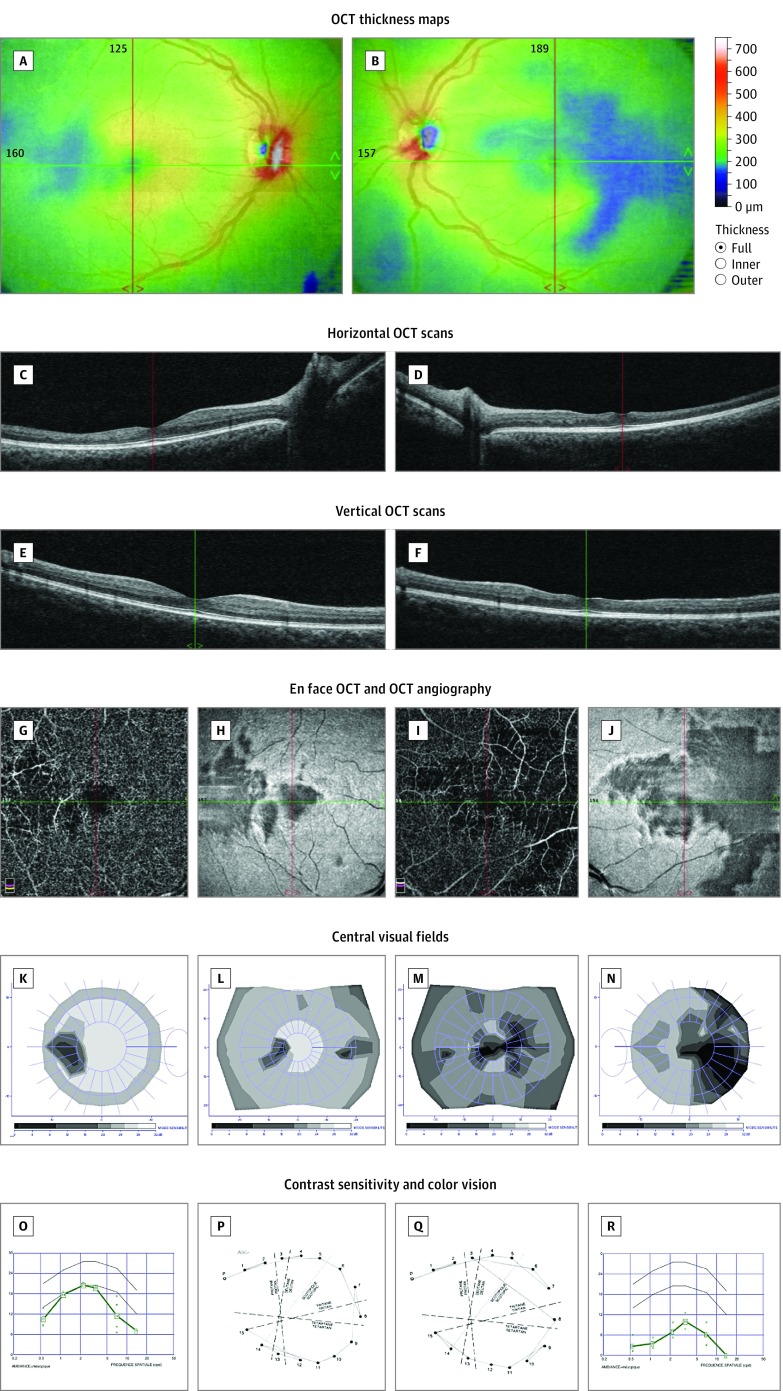
Figure 2. Multimodal Imaging and Detailed Macular Function Evaluation in Case 2.
Optical coherence tomography (OCT) thickness maps showing areas of retinal thinning in both eyes (A and B). Horizontal (C and D), vertical (E and F), and en face (H and J) OCT scans showing thinning of the inner retinal layers, with loss of the normal foveal pit in the left eye. OCT angiography showing no signal in the deep capillary plexuses in the areas of thinning (G and I). Twelve-degree and 30° central visual fields showing scotomas matching the retinal defects (K-N). Contrast sensitivity (O and R) and color vision (P and Q) were affected in both eyes. Composite figures are shown to illustrate a clear parallel between the anatomical lesions and the impaired visual function. A, C, E, G, H, K, L, O, and P are of the right eye; B, D, F, I, J, M, N, Q, and R are of the left eye.

