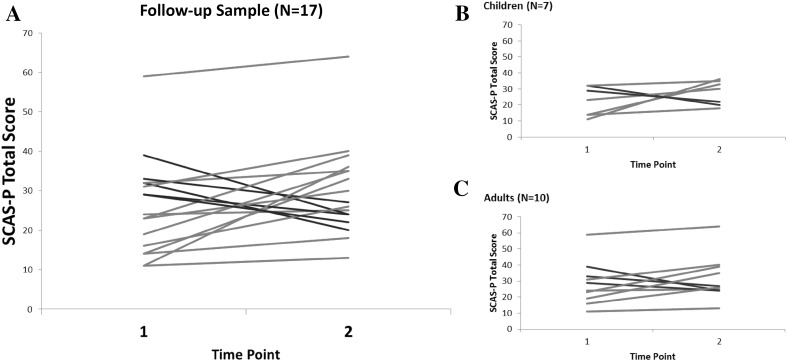
Fig. 1.
Total scores from the SCAS presented for each individual from the longitudinal sample for Time 1 and Time 2 (a), and separately for children under 18 years (b) and adults over 18 years (c), indicating change over time at the individual level. Lines in red show an increase and lines in blue show a decrease in anxiety. (Color figure online)

