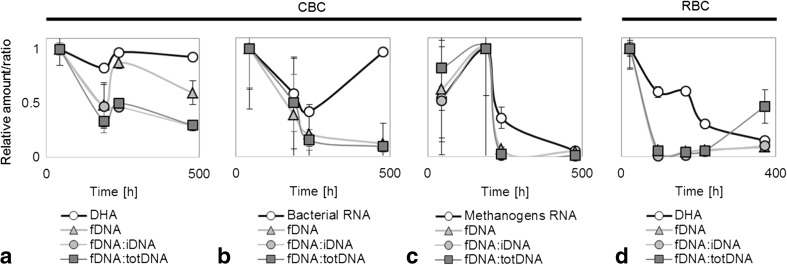
Fig. 4.
Normalized activity (y axis) of overall consortium (a, d), bacteria (b), and methanogens (c) in cattle manure- (a–c) and rumen-borne consortia over time (hours). CBC cattle manure-borne consortium, RBC rumen-borne consortium, DHA dehydrogenase activity, fDNA free external DNA, total DNA (totDNA) fDNA + bDNA + iDNA, bDNA wbDNA + tbDNA. Vertical error bars show the standard deviation (n = 3)

