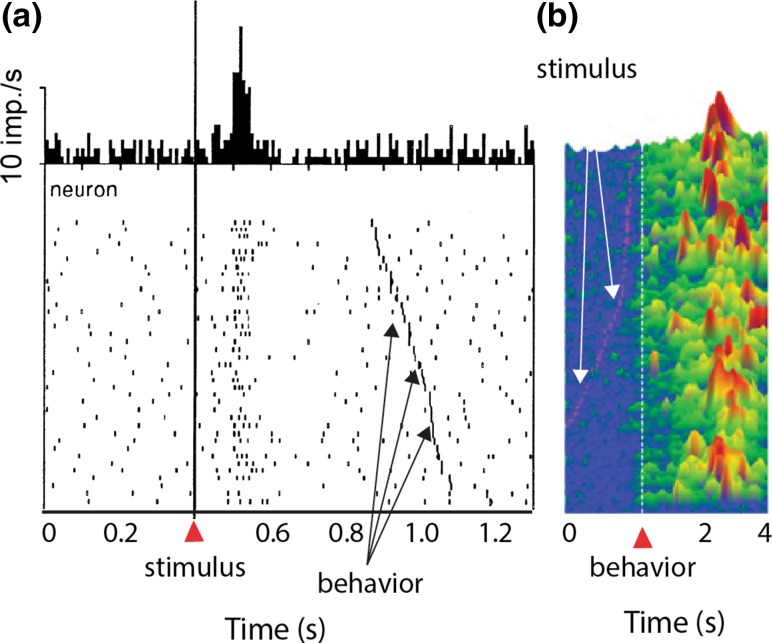
Fig. 4.
Temporal discrepancy between dopamine action potential responses recorded in the midbrain and dopamine release monitored in the striatum. a PSTH (top) and raster plot (bottom) of dopamine response to reward predicting cues. Responses were aligned onto cue onset (solid line). The time of movement onset during each trial is indicated by the dark hatches in the raster plot. This panel was adapted from (Schultz et al. 1993). b Profile of dopamine concentration change in the striatum of a rat after reward prediction. Dopamine concentration profiles are aligned to the time when the rats inserted their nose into a center port (white dashed lines). The time of instruction cues for each trial is indicated by the red ticks. This figure panel was adapted from Hamid et al. (2016)

