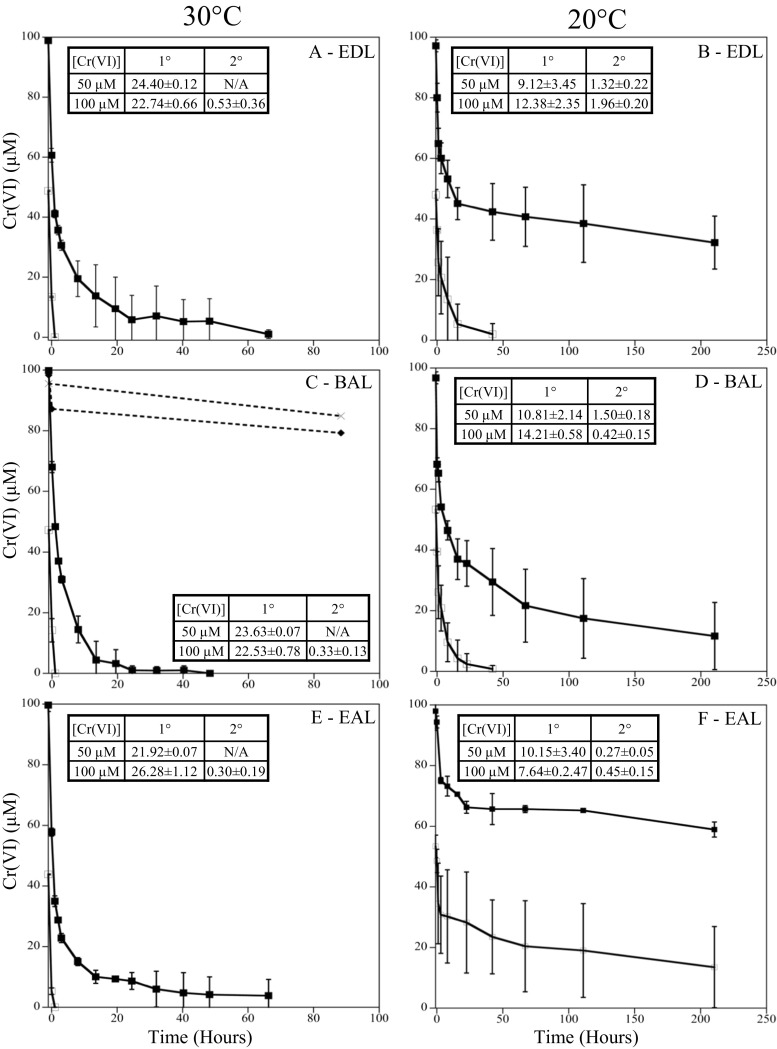
Fig. 2.
Cr(VI) reduction at 30 °C (a, c, and e) and 20 °C (b, d, and f) under EDL (a, b), BAL (c, d), and EAL (e, f) conditions with 50 (○) and 100 (■) μM Cr(VI). Dashed lines indicate heat-killed (◆) and uninoculated controls (x) (C). Cr(VI) reduction rates (μM Cr(VI)/hr) (primary and secondary) are overlaid for each condition

