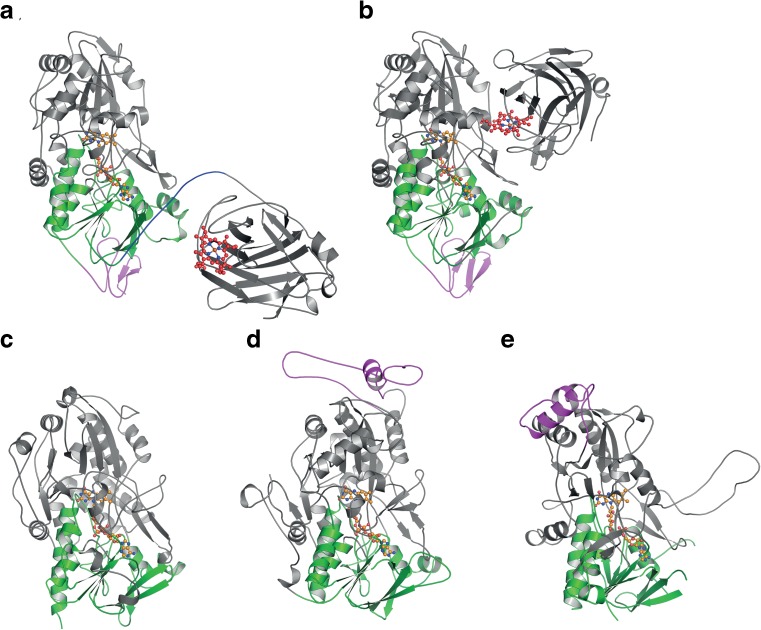
Fig. 2.
Molecular structures of representative members of the AA3 families in cartoon representation. a Neurospora crassa cellobiose dehydrogenase CDH IIA in the open conformation (PDB 4QI7 (Tan et al. 2015)), b Myricoccum thermophilum cellobiose dehydrogenase in the closed conformation (PDB 4QI6 (Tan et al. 2015)), c subunit of homo-dimeric Aspergillus niger glucose oxidase GOx1 (PDB 1CF3 (Wohlfahrt et al. 1999)), d subunit of homo-octameric Pichia pastoris alcohol oxidase AOx1 (PDB 5HSA (Koch et al. 2016)) and e subunit of homo-tetrameric Phanerochaete chrysosporium pyranose oxidase (PDB 4MIF (Hassan et al. 2013)). The FAD-binding domain is highlighted in green; FAD is shown in orange (ball-and-stick representation), and the haem b in the cytochrome domain of CDH is depicted in red (ball-and-stick representation). The carbohydrate-binding module (CBM1) of the two CDHs (a, b), the insertion loop of PpAOx1 (d) and the head domain of PcPOx (e) are shown in magenta

