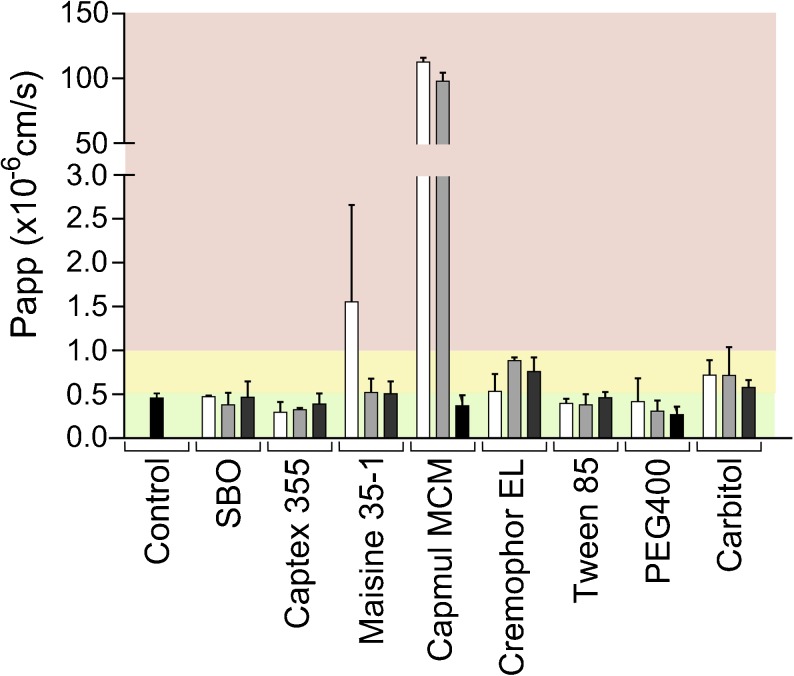
Fig. 1.
Effect of excipients on apical to basolateral transport of mannitol across Caco-2 monolayers. Bars represent average Papp values ± SD (n = 3). The black bar represent the control i.e. digestion medium. The white, light gray and, dark gray bars indicate excipient concentrations of 1.25, 0.625, and 0.125% (w/v), respectively. Red, yellow and green regions represent conditions that were not, intermediately and well tolerated.

