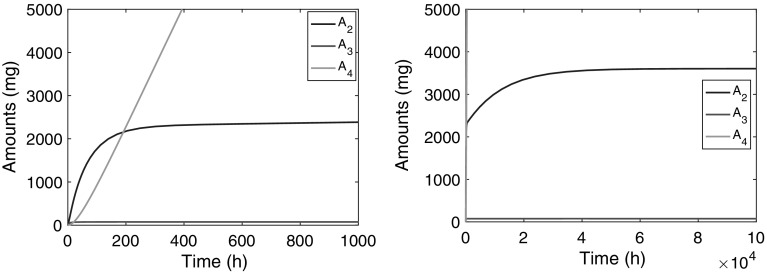
Fig. 9.
Graphs show the amount versus time courses during a constant-rate infusion over and h of compound in the second compartment ( (blue)), in the third ( (red)) and the fourth ( (green)). The left panel shows how over a period of about 500 h climbs to an intermediate steady state and the right panel shows how slowly climbs over a much longer period ( h) to its final steady state . Details about the evolution of and are shown in Fig. 10 (Color figure online)

