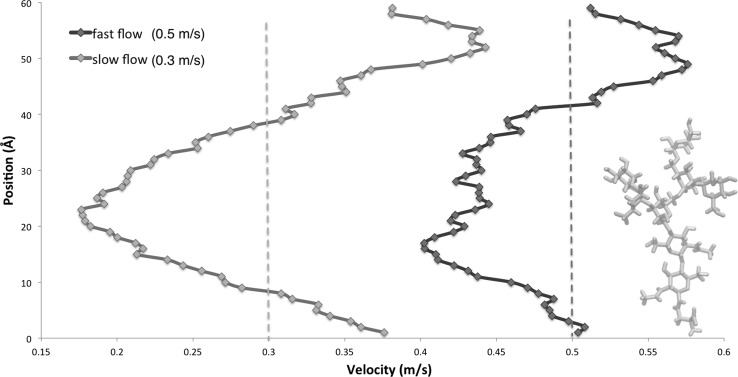
Fig. 4.
Velocity profiles across the y-axis. The dotted lines mark the average velocity for the normal (green) and reduced (purple) flow. Solid lines indicate average velocity for that segment of the y-axis, and the embedded schematic of the stretched conformation is to scale. The schematic denotes the highest possible level the constrained glycan can reach. Due to periodicity, this velocity profile is repeated above and below the end-points of the y-axis (there is no boundary effect). The water velocity profile across the y-axis was calculated by averaging the individual water oxygen velocities of overlapping 7 Å-wide slabs of the simulation box. In the case of the larger driving force, the average velocity seems smaller than the one indicated by the dashed line. This is an artefact of the per-slab velocity calculation, as the layers in the slabs overlap. The dotted line therefore indicates the true mean velocity as calculated for all water molecules (colour figure online)

