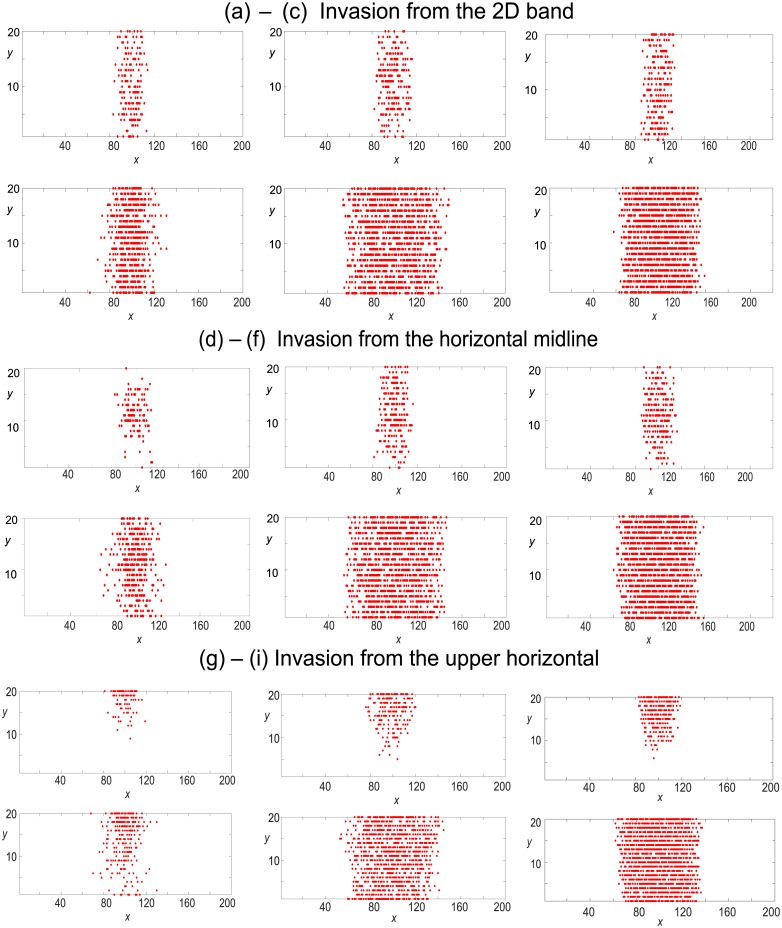
Fig 3. Single realisations of the agent–based model displaying snap–shots of cell distributions from invasion of an empty domain from three separate locations (displayed in Fig 2).
Red cells enter the domain at a rate of four attempts per time-step. Simulations are displayed at times t = 50, 250. The first column denotes gentlemen invaders, the middle column denotes simple shover invaders and the third column denotes smart shover invaders.

