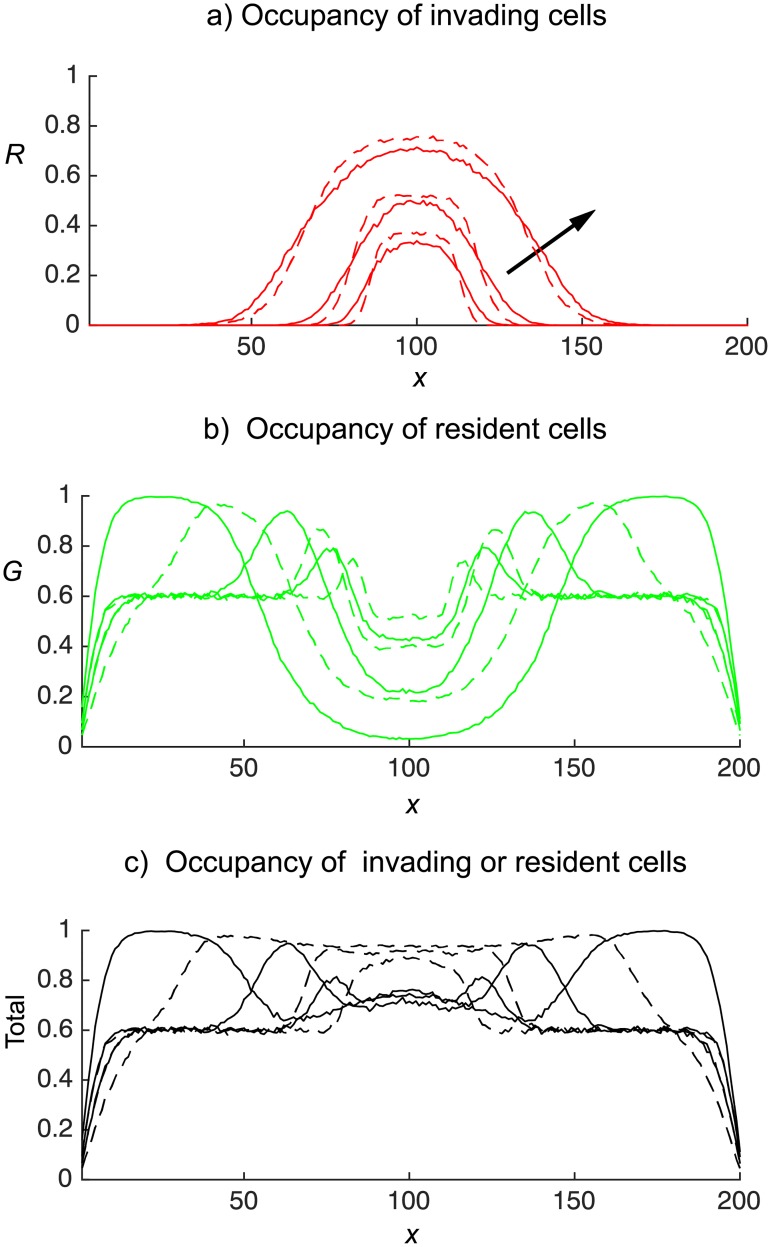
Fig 7. Invasion of an occupied domain from the horizontal midline (displayed in Fig 2(b)).
Green gentlemen cells are present with density cG = 0.6. Red cells enter the domain at a rate of four attempts per time-step. The continuous curves denotes simple shovers, and broken curves denotes smart shovers. Site occupancies, obtained from the agent–based model, are averaged over 300 independent realisations at times t = 50, 100, 250. Arrows show increasing time.

