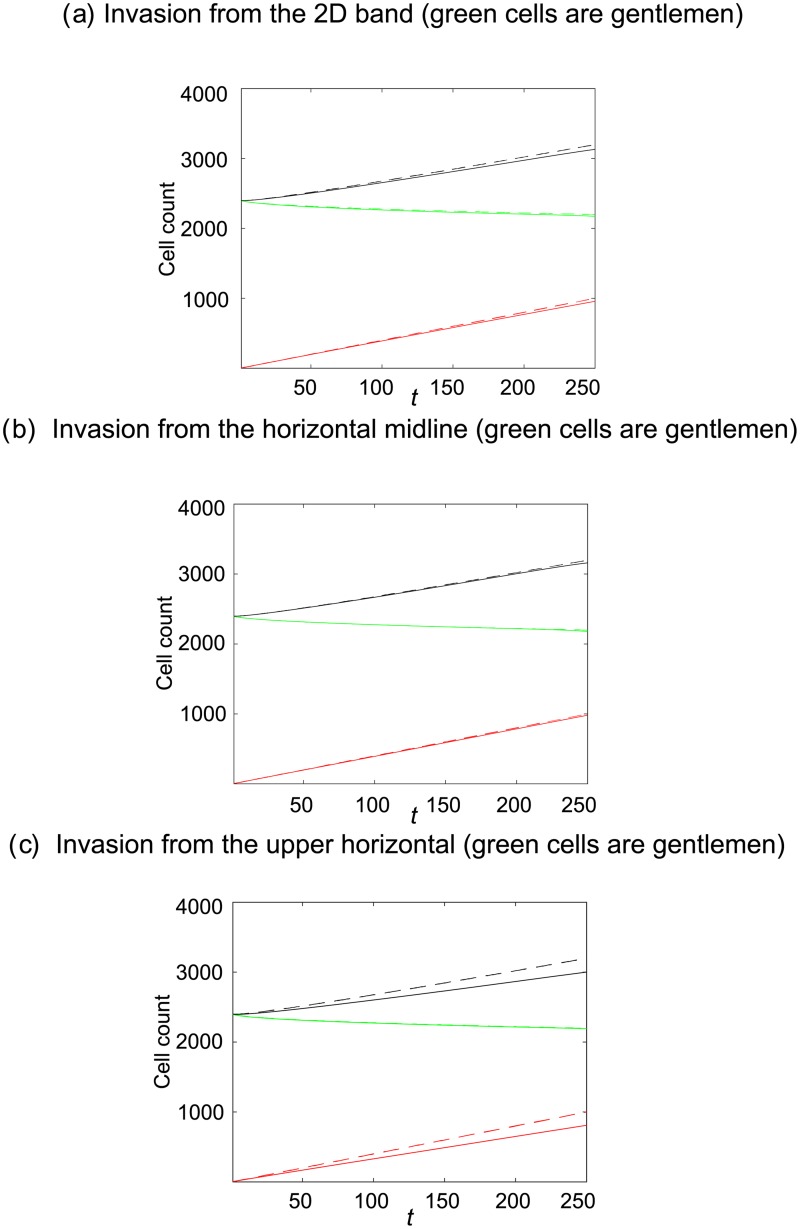
Fig 9. Cell counts, averaged over 300 realisations of the agent–based model, from invasion of an occupied domain (uniformly seeded green gentlemen cells with cell density cG = 0.6).
Continuous lines denote the scenario where invaders are simple shovers, whereas broken lines denote the scenario where invaders are smart shovers. Red cells enter the domain at a rate of four attempts per time-step. The red lines denotes the number of red cells present, the green lines denote the number of green gentlemen cells present and the black lines denote the total number of cells present.

