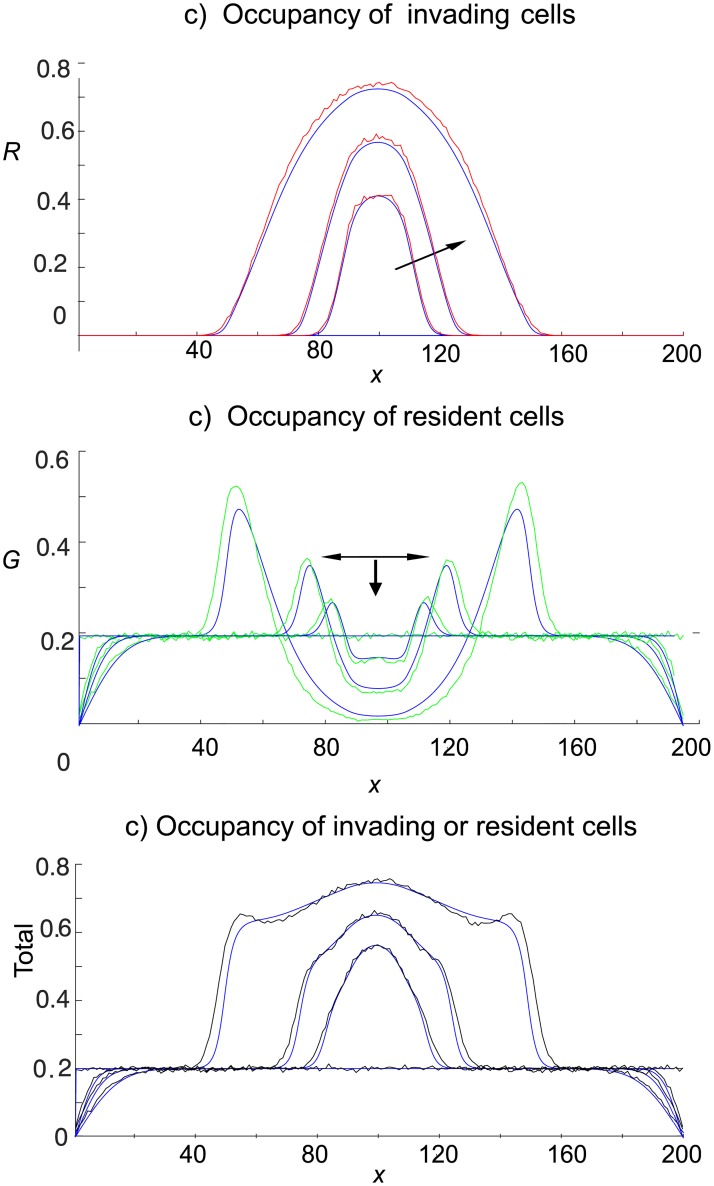
Fig 10. Averaged simulations of the agent–based model compared with the solutions from their mean-field continuum limit PDEs.
Red cells are simple shovers and green cells are gentlemen. Red cells enter the domain in the 2D band in the centre of the lattice, and invasion occurs at a rate of four attempts per time-step (which corresponds to an entry probability Pentry = 0.01). The initial concentration of green cells is cG = 0.2. Blue curves are PDE solutions. Simulation results are given at t = 0, 50, 100, 250. Simulations are averaged over 300 realisations of the agent–based model. The red cells shoving the green cells leads to crowding of the green cells to the left and right of the invasion region. Site occupancy exceeds 0.65 for much of the lattice by time t = 250. Arrows show increasing time.

