
Figure 5. Positional relationship between compartment flip and TAD boundary.
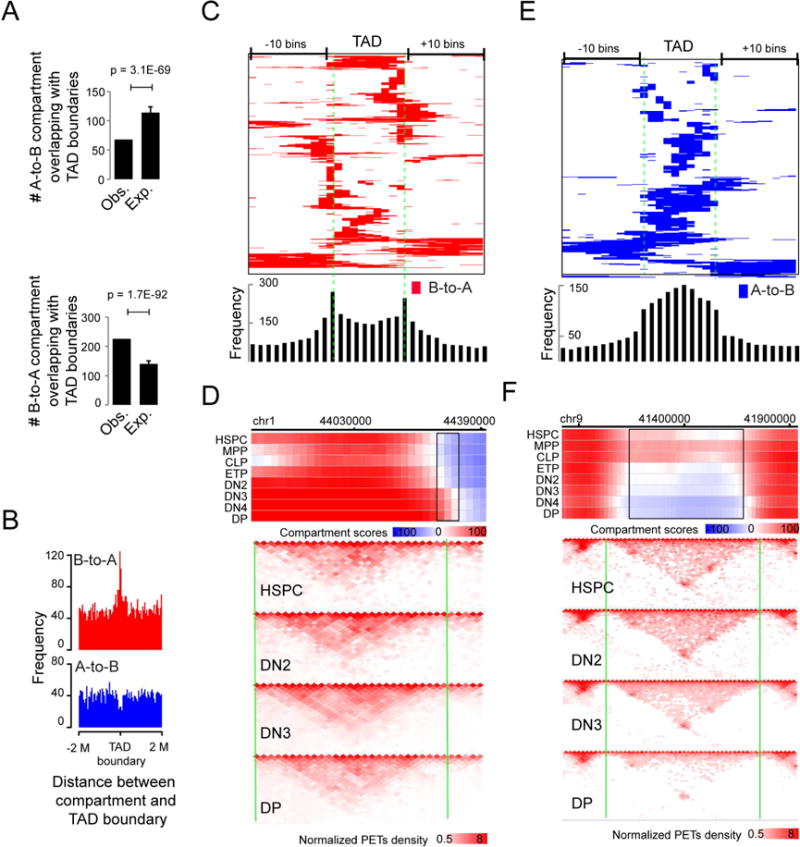
(A) Number of A-to B (upper panel) or B-to-A (lower panel) concordantly flipped compartment regions overlapping with TAD boundaries and expectations by assuming a random distribution of the flipped compartment regions across the genome. P-value by t-test. Mean ± standard deviation.
(B) Frequencies of the distance between the center of the B-to-A (upper panel) or A-to-B (lower panel) flipped compartment regions and TAD boundary.
(C) Heat map showing the distribution of B-to-A flipped genomic regions across TADs (>200K bps), equally divided into 10 portions and extended 10 bins on both sides. Bottom panel: the frequency of A-to-B compartment flips across TADs.
(D) Upper panel: heat map showing the distribution of compartment score across a genomic region including a B-to-A compartment flips (black rectangles) occurred at a TAD boundary (vertical green line). Lower panel: normalized interaction matrices (pooled from replicates) at a resolution of 20K bps across the same genomic regions as in the upper panel for HSPC, DN2, DN4 and DP cells. Pooled from 2-5 independent experiments (also applied to F).
(E) Heat map showing the distribution of A-to-B flipped genomic regions across TADs (>200K bps), equally divided into 10 portions and extended 10 bins on both sides. Bottom panel: the frequency of B-to-A compartment flips across TADs.
(F) Upper panel: heat map showing the distribution of compartment score across a genomic region including an A-to-B compartment flip (black rectangles) within a TAD. Vertical green lines: TAD boundaries; Lower panel: normalized interaction matrices (pooled from replicates) at a resolution of 20K bps for HSPC, DN2, DN4 and DP cells.