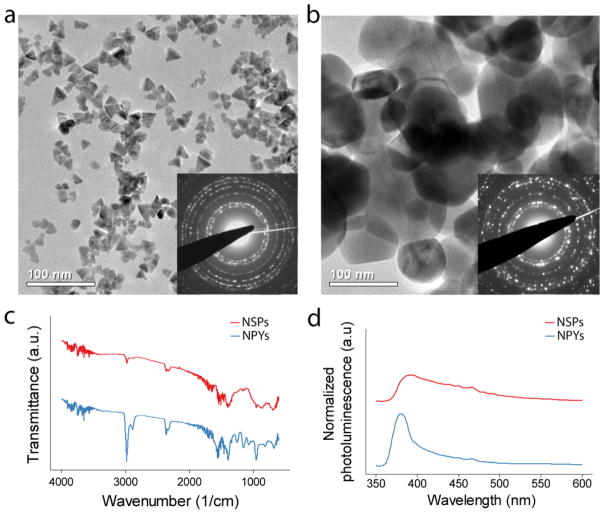
Figure 1.
Transmission electron micrographs of (a) ZnO-NPYs and (b) ZnO-NSPs. Insets show selected area electron diffraction. (c) Fourier transform infrared spectra and (d) photoluminescence spectra of corresponding ZnO-NPs. The spectra in (c & d) were shifted with respect to the ordinate for clarity.

