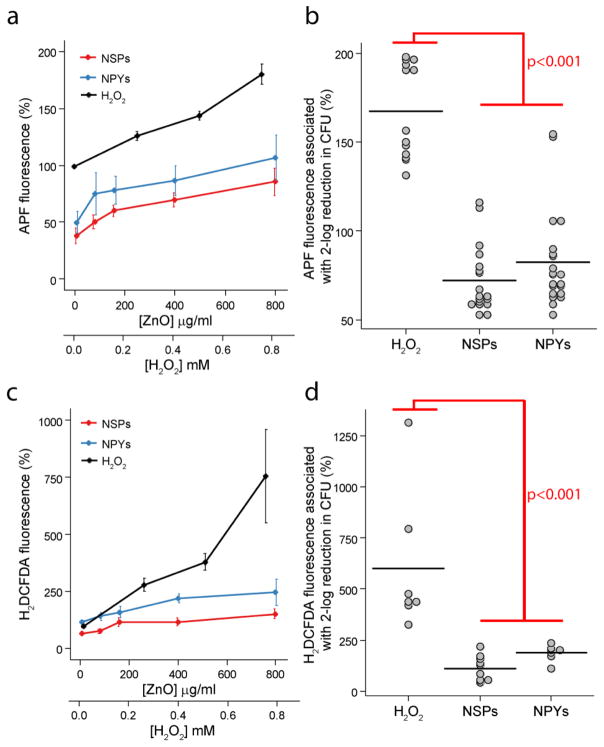
Figure 3.
Dose and shape-dependent ROS production by (a) APF and (c) H2DCFDA fluorescence after exposure to ZnO-NPYs and -NSPs as well as H2O2. Note the different scales of abscissa for ZnO-NPs. Error bars represent standard error of five independent experiments run on different days. (b) Dot plots of APF and (d) H2DCFDA fluorescence associated with a two-log reduction in CFUs for each treatment. Black horizontal lines represent the mean value. p-values represent significant difference determine by ANOVA with repeated measures and post-hoc Tukey testing.

