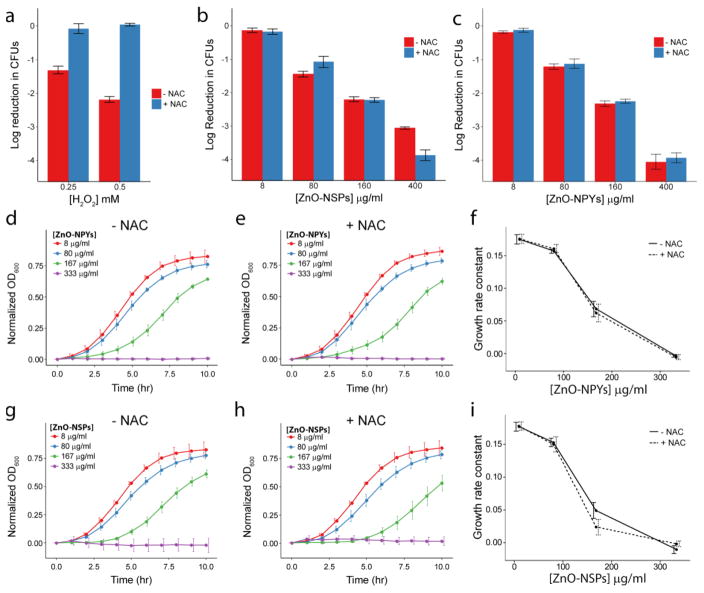
Figure 5.
Reduction in colony counts (from 5×10⁷) observed after exposure to increasing concentrations of (a) H2O2, (b) ZnO-NSPs, or (c) ZnO-NPYs with and without 50 mM NAC. Growth curves of S. aureus in ZnO-NPYs dispersions of increasing concentration (d) without and (e) with NAC. Growth curves for S. aureus in ZnO-NSP dispersions (g) without and (h) with NAC. Growth rate constants as a function of (f) ZnO-NPY or (i) ZnO-NSP concentration. Error bars represent standard error of five independent experiments run on different days.

