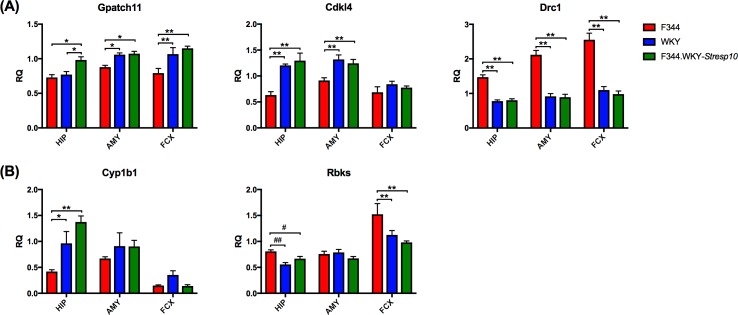
Fig 3. Expression analyses of candidate quantitative trait genes in the hippocampus, amygdala, and frontal cortex of F344, WKY, and F344.WKY-Stresp10 adult male rats.
(A) Candidate genes with similar expression between the WKY and F344.WKY-Stresp10 strains, but different from the F344, in two or more brain regions. (B) Genes that express a similar pattern in only one brain region. Data are presented as mean ± standard error of mean. N = 5–7 per group. * P < 0.05 and ** P < 0.01 by two-way ANOVA followed by Bonferroni’s multiple comparisons test. # P < 0.05 and ## P < 0.01 by Student’s t-test.

