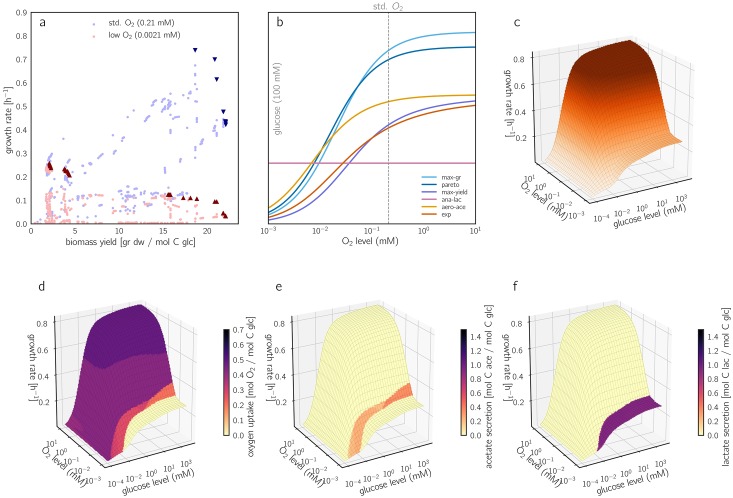
Fig 4. Growth rates and rate/yield trade-offs depending on glucose and oxygen levels.
(a) Predicted growth rates and biomass yields of aerobic EFMs, at reference oxygen level (0.21 mM) and at a lower level (2.1 μM). Pareto-optimal EFMs are marked by dark triangles. Since changing oxygen levels affect the growth rate, but not the yield, points move vertically between the two conditions. Statistical distributions of growth rates across EFMs are shown in Figure 10 in S1 Text. (b) Oxygen-dependent growth rates for the five focal EFMs and the measured flux distribution. The oxygen level directly affects the catalytic rate of oxidative phosphorylation (reactions oxphos and sdh): lower oxygen levels require higher enzyme levels for compensation, to keep the fluxes unchanged. The non-respiring EFM ana-lac shows an oxygen-independent growth rate. In all other focal EFMs, the growth rate increases with the oxygen level and saturates around 10 mM. max-gr, which uses a higher amount of oxygen, has a steeper slope and loses its lead when oxygen levels drop below 1 mM. The corresponding changes in enzyme allocation are shown in Figure 18 in S1 Text. (c) Growth rate as a function of glucose and oxygen levels (“Monod surface”). For a closed approximation formula, see Section 4.6 in S1 Text. (d)-(f) The same plot, with oxygen uptake, acetate secretion, and lactate secretion shown by colors. Distinct areas represent different optimal EFMs (compare Figure 13 in S1 Text). The optimal EFMs for strictly anaerobic conditions are depicted in Figure 15 in S1 Text (b).

