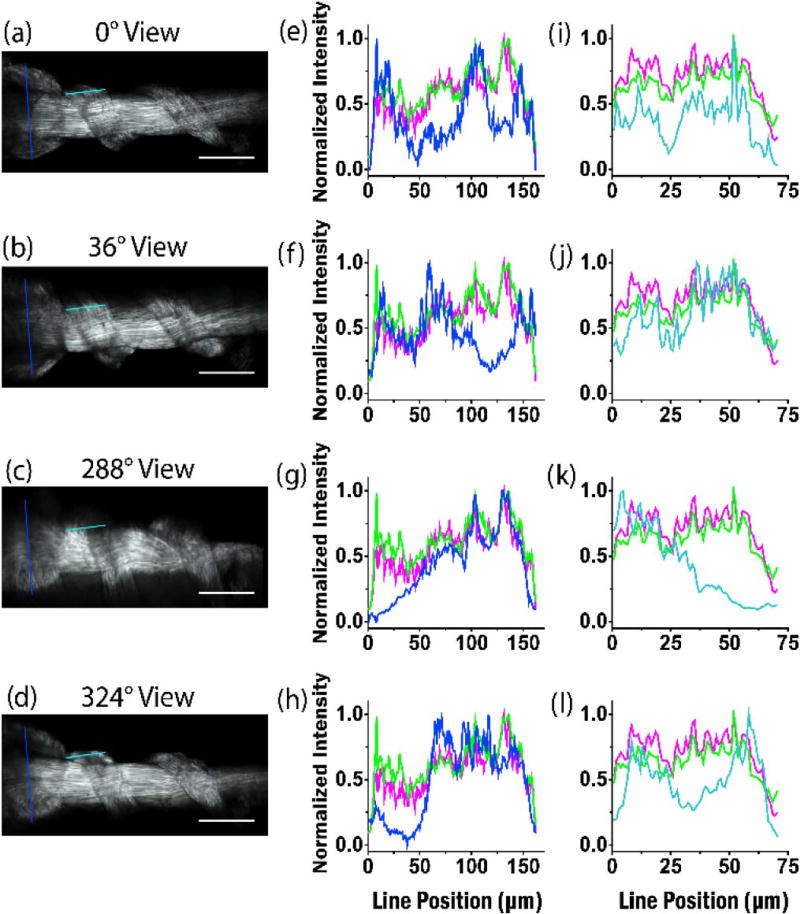
Fig. 8.
Contrast assessments of identical planes of the coiled tendon via line profile intensity plots drawn in the exact same position. Single views are shown in (a)–(d) and the respective intensities are plotted in blue in (e)–(h). The results for the high-frequency fusion and Gaussian-weighted reconstructions (Fig. 7) are plotted in purple and green, respectively. Line plots from a second region are shown in (i)–(l), where the single view intensities are shown in cyan. Scale bar = 100 µm.

