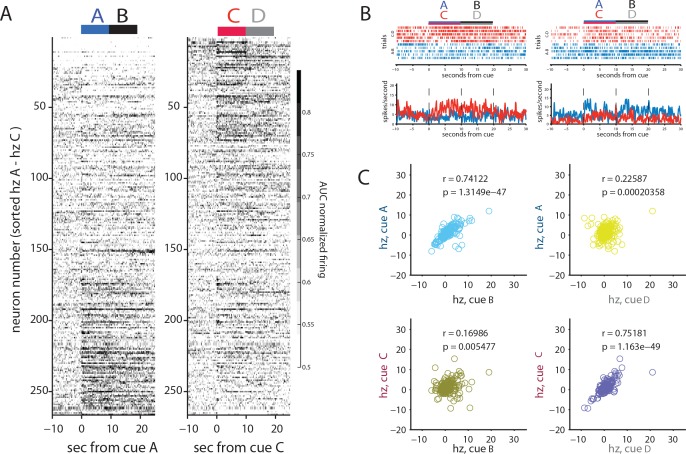
Figure 2. Orbitofrontal neurons encode preconditioned pairs in the absence of reward.
(A) AUC normalized responding of all 266 neurons recorded across the two days of preconditioning for either A-B trials (blue, left) or C-D trials (red, right), sorted by for the relative response to cue pairs (cues AB vs CD). The plots show that different neurons seem to fire to the AB pair or the CD pair. (B) Cue-evoked firing in two individual neurons shows differential firing to either the AB or CD pair. (C) Correlations between individual neural responses to paired or unpaired cues above the neuron’s average responding. Plots reveal much greater correlated firing between paired than unpaired cues during preconditioning (A-B, top left; C-D, bottom right).


