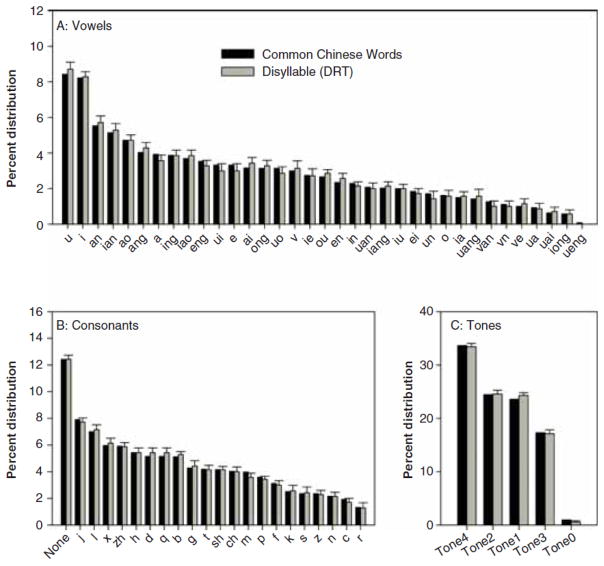
Figure 1.
The percent distribution of 35 vowels (A), 21 consonants (B), and 5 tones (C) across 3500 commonly used Chinese characters (black bars; data from Tang [15]) and for the DRT materials (gray bars). All the vowels and consonants were used according to the international standard Scheme of the Chinese Phonetic Alphabet ([19]; http://en.wikipedia.org/wiki/Pinyin). Note that ‘None’ in (B) indicates the percent distribution of Chinese characters that have no initial consonants. Tones 0–4 represent neutral, flat, rising, falling-rising, and falling tones, respectively. Error bars show the standard error of the percent distribution across lists.

