
Figure 7.
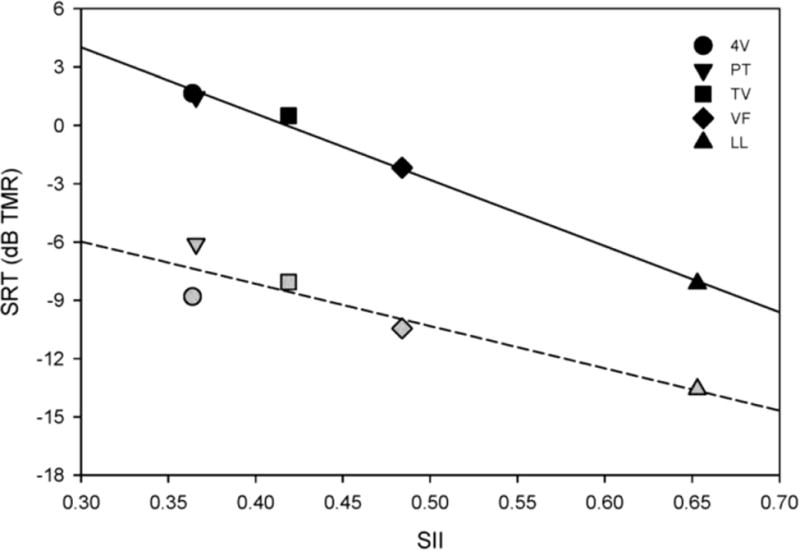
Mean SRTs as a function of SII, for the MSN (left panel), MSMN (middle panel) and MUS (right panel) maskers. The black symbols show CI data and the gray symbols show NH data; the symbol shapes show different songs. The solid lines show linear regressions for CI data and the dashed lines show linear regressions for NH data.