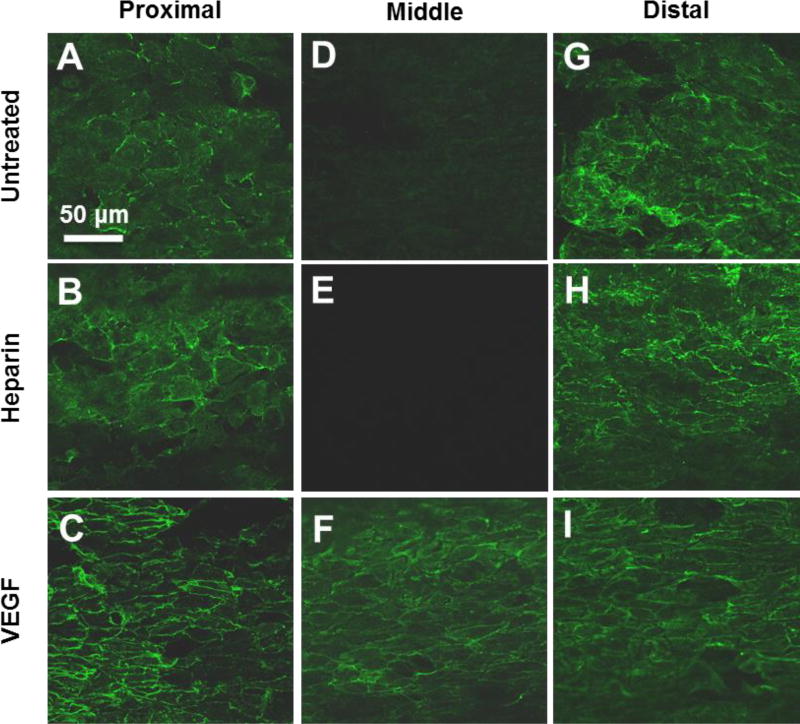
Figure 5.
High magnification images of ECs on the inner surface of the vascular grafts at 2 weeks post implantation. The inner surfaces of the grafts were stained for EC surface marker CD31. Representative images of inner surface were taken from proximal, middle and distal graft segments. Scale Bar = 50 µm.

