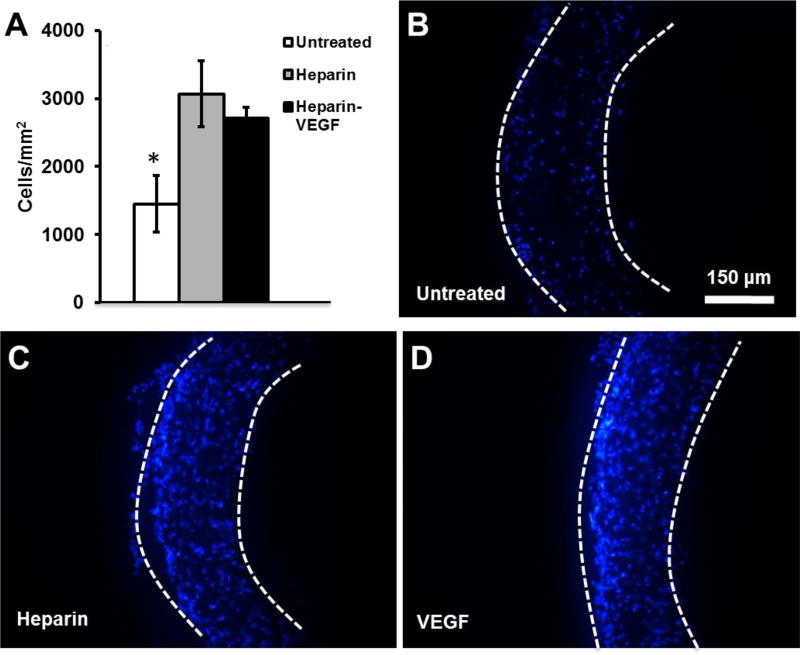
Figure 7.
Cell infiltration into electrospun vascular grafts at 1 month post-implantation. Nuclei are stained by DAPI. (A) Cell density within the graft was quantified. (B–D) Cross-sections of explanted electrospun vascular grafts 1 month post-implantations. The boundary of the graft is marked by dashed lines. Scale bar = 150 µm.

