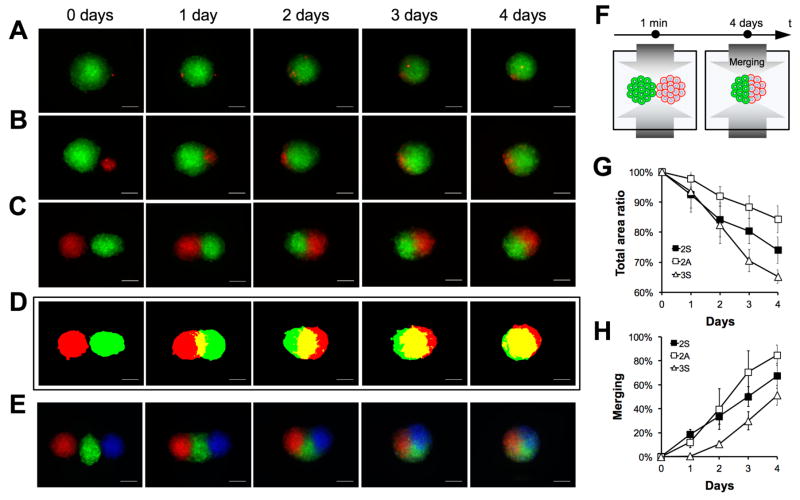
Figure 3. Biological units interaction and merging.
Single cell (A) and spheroid with different (B) or similar (C) sizes were magnetically guided to interact in pairs. The interaction was monitored in situ for 4 days using bright field and fluorescent microscopy. Representative topographical maps of similar size spheroids doublets are presented for each time point of the merging (D). Images of spheroid triplets merging over time are also presented (E). Scale bar, 200μm. Illustration of the merging process (F). Total fluorescence area ratio (G) and merging percentage (H) were measured and plotted as a function of time for symmetric (2S) and asymmetric duplets (2A), and symmetric triplets (3S). The data are presented as a mean ± SD (n=8 for 2S, n=3 for 2A and n=5 for 3S)

