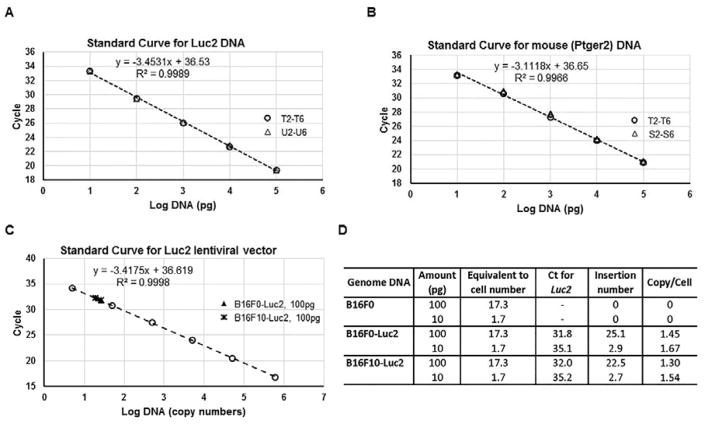
Fig. 2.
Standard curves with different genomic DNA samples show the linearity and consistence of real-time quantitative PCR for both Luc2 and Ptger2 genes. (A) The mean Ct (y-axis) of the serial Luc2+ genomic DNA dilutions in Table 1 (Group T and Group U, without or with addition of Luc2− DNA) were plotted against log values (x-axis) of DNA input (in picogram) to create a Luc2 DNA standard curve. The data points from two groups were indicated: ○, group T; △, group U. (B) The mean Ct (y-axis) of the serial Luc2+ and Luc2− genomic DNA dilutions in Table 1 (Group T and Group S) were plotted against log values (x-axis) of DNA input (in picogram) to create a Ptger2 DNA standard curve. The data points from two groups were indicated: ○, group T; △, group S. (C) The mean Ct (y-axis) of the serial pLU-Luc2 lentiviral plasmid dilutions were plotted against log values (x-axis) of DNA input (in plasmid copy numbers) to create a linear standard curve for Luc2 lentiviral vector. The data points from sample groups were indicated: ○, lentiviral plasmid; ▲, 100pg of B16F0-Luc2 genomic DNA; *, 100pg of B16F10-Luc2 genomic DNA. (D) Calculation of lentiviral inserted copy numbers from the Ct values using indicated amount of DNA from B16F0, B16F0-Luc2 or B16F10-Luc2. The calculated DNA amount per mouse cell (diploid) is 5.77pg (see calculation in Experimental section), hence the cell number for 100pg of DNA is: 100/5.77=17.3.

