Fig. 2. Segmentation methods.
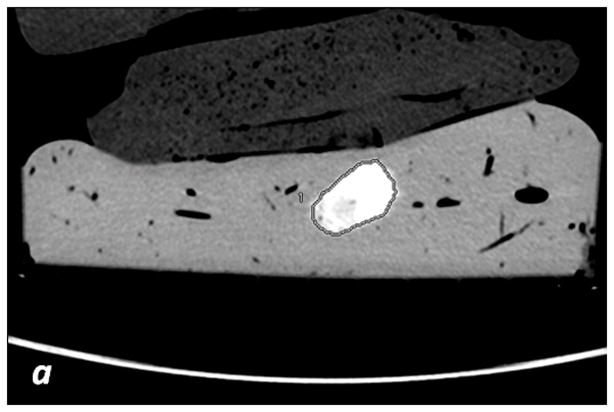
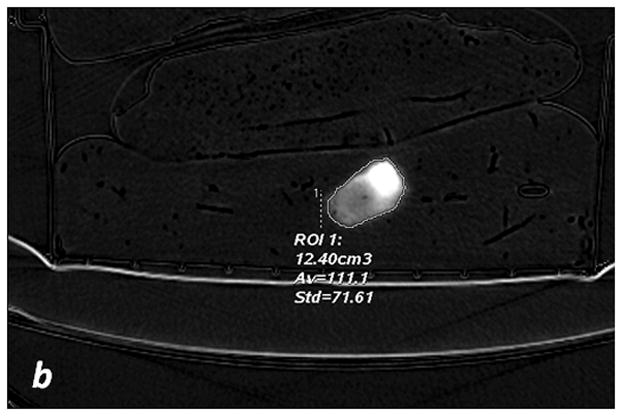
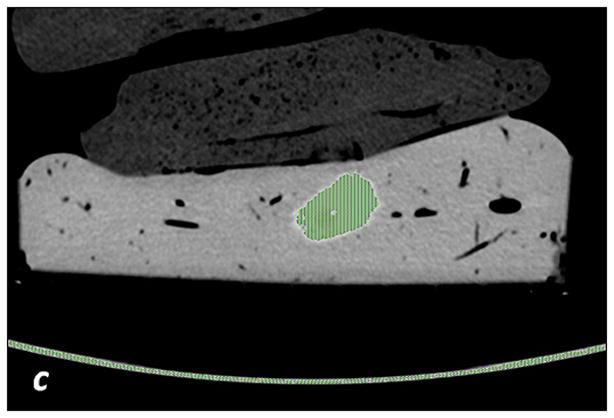
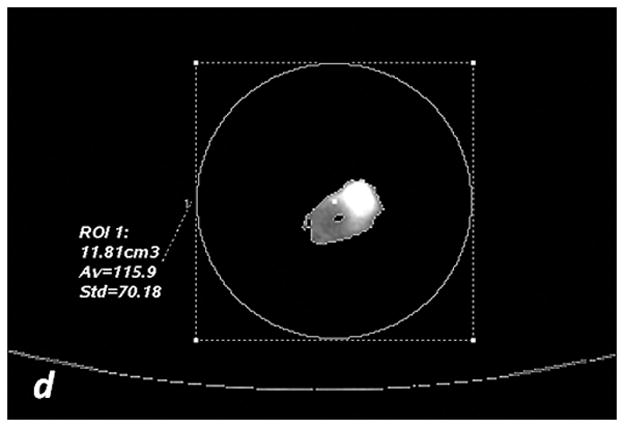
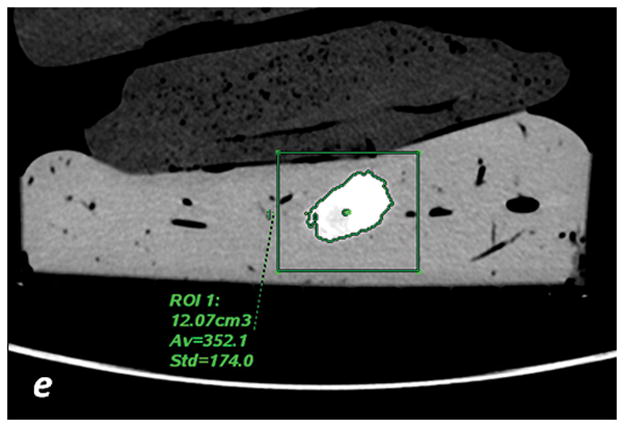
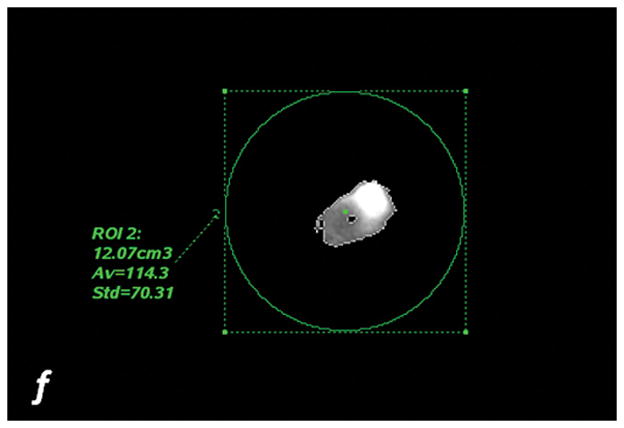
a, c, e: axial monochromatic 70 keV images. b, d, f: axial iodine (-water) images. a, b: manual segmentation. In a, sausage boundaries are manually outlined on each monochromatic axial slice to obtain a 3D ROI of the sausage. The ROI is propagated on iodine (-water) images, and the software calculated the sausage volume (b, in cm3) and iodine concentration (b: Av, 102 μg/cm3). c, d: fixed threshold. Each radiologist fitted the green mask (c) to all sausages of the scanned liver by adjusting the minimum attenuation value (fixed threshold for each liver, in HU). The software extracts the voxels with HU values between the thresholds; sausage volume (d, in cm3) and iodine concentration (d: Av, 102μg/cm3) are calculated with a spherical 3D ROI (d). e, f: semi-automatic segmentation. In e, after placing a seeding point within the sausage, a parallelepiped ROI includes the spatial region of the sausage whereas an irregular 3D ROI is grown along the sausage boundaries. Each radiologist visually corrected the boundaries of the inner ROI by scrolling a control bar. The sausage volume is extracted on the monochromatic images and on iodine (-water) images. After placing a spherical ROI, the software calculated sausage volume (e, in cm3) and iodine concentration (f: Av, 102μg/cm3).
