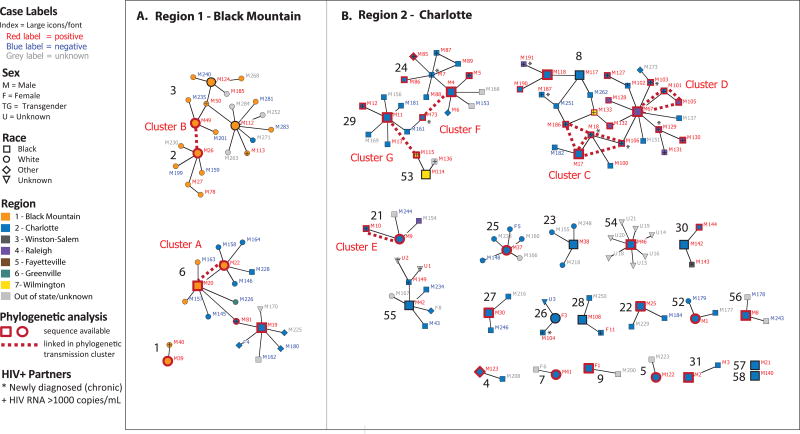
Figure 2.
Contact tracing network components stemming from index cases diagnosed during acute HIV infection (n=32) and their reported partners (n=118 non-index cases) investigated in two regions in North Carolina, 2012–2014. Components are labeled with black numbers and index cases nodes are large while contacts nodes are small. HIV-infected cases and contacts have red labels and those with available sequences are indicated with red outlines. Dashed lines depict cases linked in phylogenetic clusters and are labeled with cluster names (A–G). Panel A. Region 1 (Black Mountain) involves 4 components, including components 3 and 2 which are linked by phylogenetic cluster (B) but not by contact tracing. Panel B. Region 2 (Charlotte), where most index cases were found in small components not linked in clusters. One large component (8) involves two distinct phylogenetic clusters (C & D) and multiple index cases not in clusters. Clusters F and G phylogenetically link cases that are not connected in contact trancing components.

