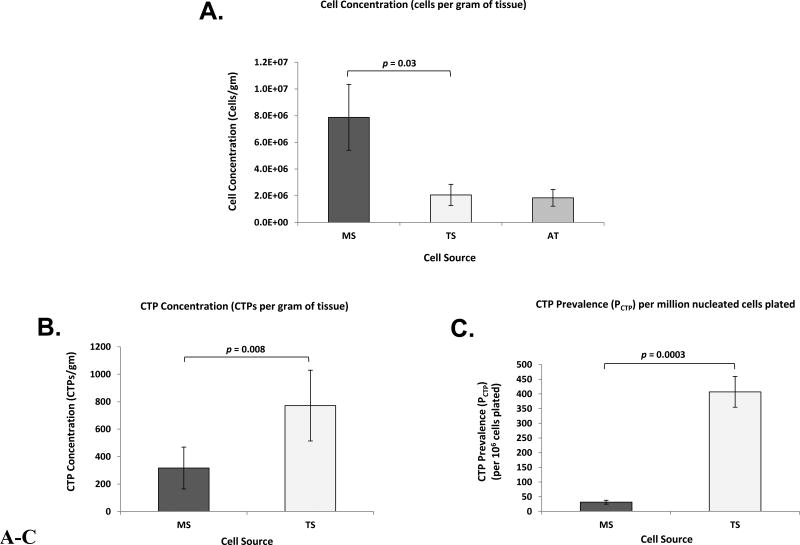
Figure 2.
A–C. Bone and Adipose Tissue Derived Primary Cells - Cell Concentration, CTP Concentration, and CTP Prevalence. Bar graphs represent: (A) cell concentrations (cells per gram of tissue) of MS, TS, and AT; (B) CTP concentrations (CTPs per gram of tissue) of MS and TS; and (C) CTP prevalence (PCTP) per million nucleated cells plated of MS and TS. Data are presented as Mean ± Standard Error, (n = 8). CTP: Connective Tissue Progenitor, MS: Marrow Space, TS: Trabecular Surface, AT: Adipose Tissue.

