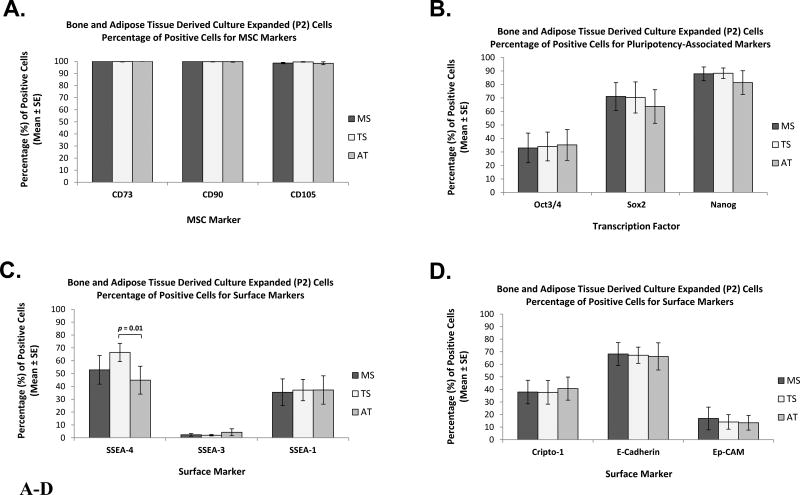
Figure 6.
A–D. Marker Characterization of Bone and Adipose Tissue Derived Culture-Expanded (P2) Cells by Flow Cytometry - Comparison between Tissue Sources. Bar graphs represent percentage of positive cells for: (A) Classical MSC surface markers CD73, CD90, and CD105; (B) pluripotency-associated transcription factors Oct3/4, Sox2, and Nanog; (C) surface markers SSEA-4, SSEA-3, and SSEA-1; and (D) surface markers Cripto-1, E-Cadherin, and Ep-CAM. Data are presented as Mean ± Standard Error, (n = 8). MSC: Mesenchymal Stromal Cell; MS: Marrow Space; TS: Trabecular Surface; AT: Adipose Tissue.

