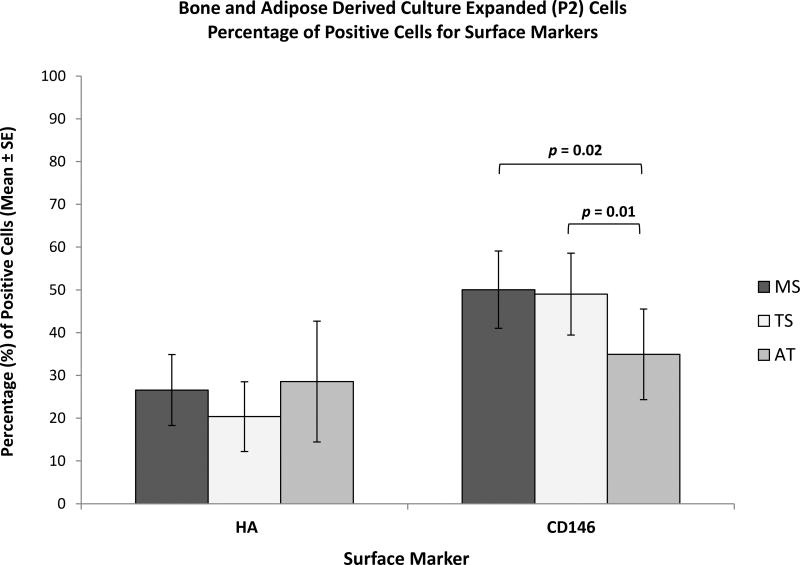
Figure 7.
Marker Characterization of Bone and Adipose Tissue Derived Culture-Expanded (P2) Cells by Flow Cytometry - Comparison between Tissue Sources. Bar graphs represent percentage of positive cells for surface markers HA and CD146. Data are presented as Mean ± Standard Error, (n = 8). MS: Marrow Space; TS: Trabecular Surface; AT: Adipose Tissue.

