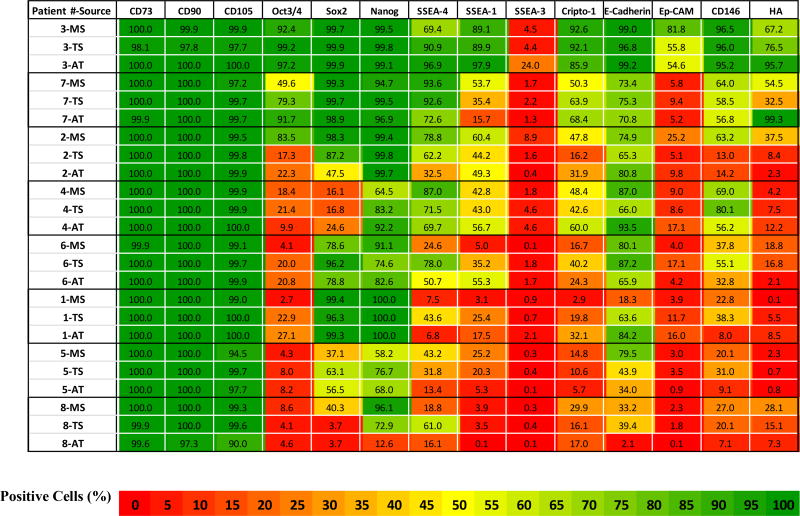
Table III.
Marker Expression Heat-Map Data. Percent expression for each marker in MS, TS, and AT derived culture-expanded (P2) cells per each patient sample. Flow cytometry data are presented as heat-map table using 3 color-scale (Red: Lowest (0%); Yellow: Midpoint (50%); and Green: Highest (100%)). Patients have been ranked roughly from top to bottom based on overall sum of expression levels to better illustrate the range of variation. All patients had advanced arthritis of the hip. Patients with a diagnosis of adult rheumatoid arthritis, juvenile rheumatoid arthritis, and osteonecrosis are patients 2, 7, and 4 respectively.
MS: Marrow Space; TS: Trabecular Surface; AT: Adipose Tissue.

