
Figure 3. Dissolution limited drug elution decreased temporal gradients in drug delivery.
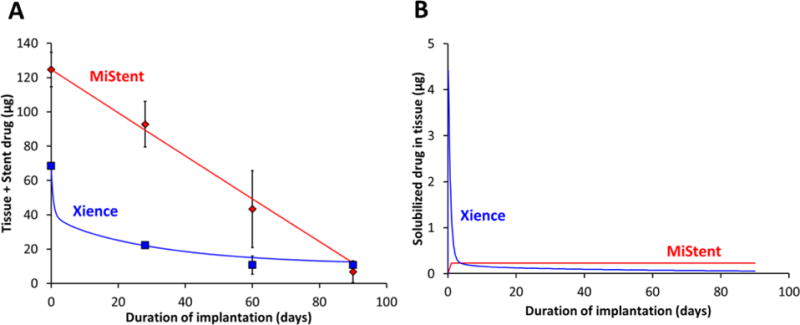
(A) Total amount of drug in the stented artery (tissue+stent). (B) The amount of solubilized/pharmacologically active drug distributed in the tissue. Measured (symbols) and computationally predicted (lines) levels for Xience (blue) and MiStent (red).